

Why teams need a north star
As a SaaS company grows, every team pushes its own agenda. Engineering wants a rewrite, product wants more features, growth wants a better onboarding flow, marketing wants more MQLs. Each goal makes sense on its own, and together they pull the company in four directions.
A north star metric is the fix: one number that best captures the value customers get from your product, which every team can see its work contributing to. Amplitude defines a good one by three qualities:
- It represents the value users get from your product.
- It's within product and marketing's sphere of influence.
- It's a leading indicator of revenue.
It doesn't replace KPIs or OKRs. KPIs are the many health numbers you track; OKRs are time-boxed goals. The north star sits above both: it's the outcome your OKRs should move, and the one KPI that every team is asked to explain its work against.
This page is about putting one in place. For the metrics real companies chose, see our list of north star metric examples.
How to choose your north star metric
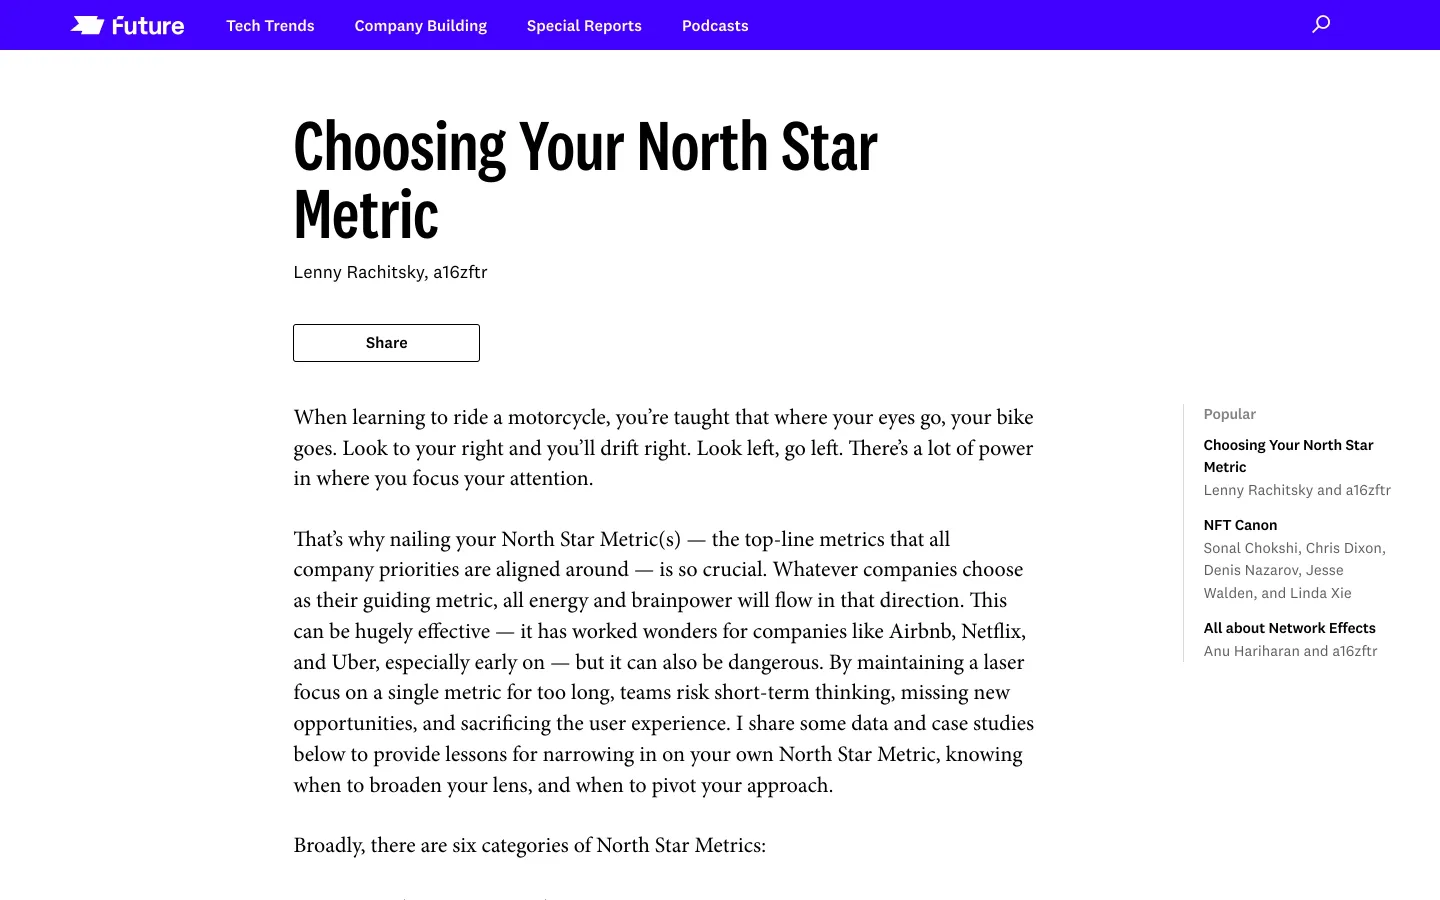
Start with Lenny Rachitsky's key question: which metric, if it increased today, would most accelerate your business's flywheel? Then narrow it down:
- Name the game you're playing. Amplitude's North Star Framework sorts products into three games: attention (how much time people spend), transaction (how many purchases or exchanges happen) and productivity (how efficiently people get work done). Most B2B SaaS plays the productivity game, so the north star counts work completed, not time spent.
- Find the value moment. The point where a customer gets what they came for: a booking made, a report shared, a document signed.
- Write it as a behavior with a time window. “Weekly accounts with 3+ active users” beats “engaged accounts”. A weekly window stops teams from inflating it with one-off activity.
- Check it against your data. It should predict retention and expansion. If accounts that hit it don't retain better, it isn't measuring value.
- Run it past the checklist. Is it understandable by everyone, measurable, actionable, and not a vanity number? Amplitude suggests first brainstorming a terrible north star for your company; the anti-examples make the good one easier to see.
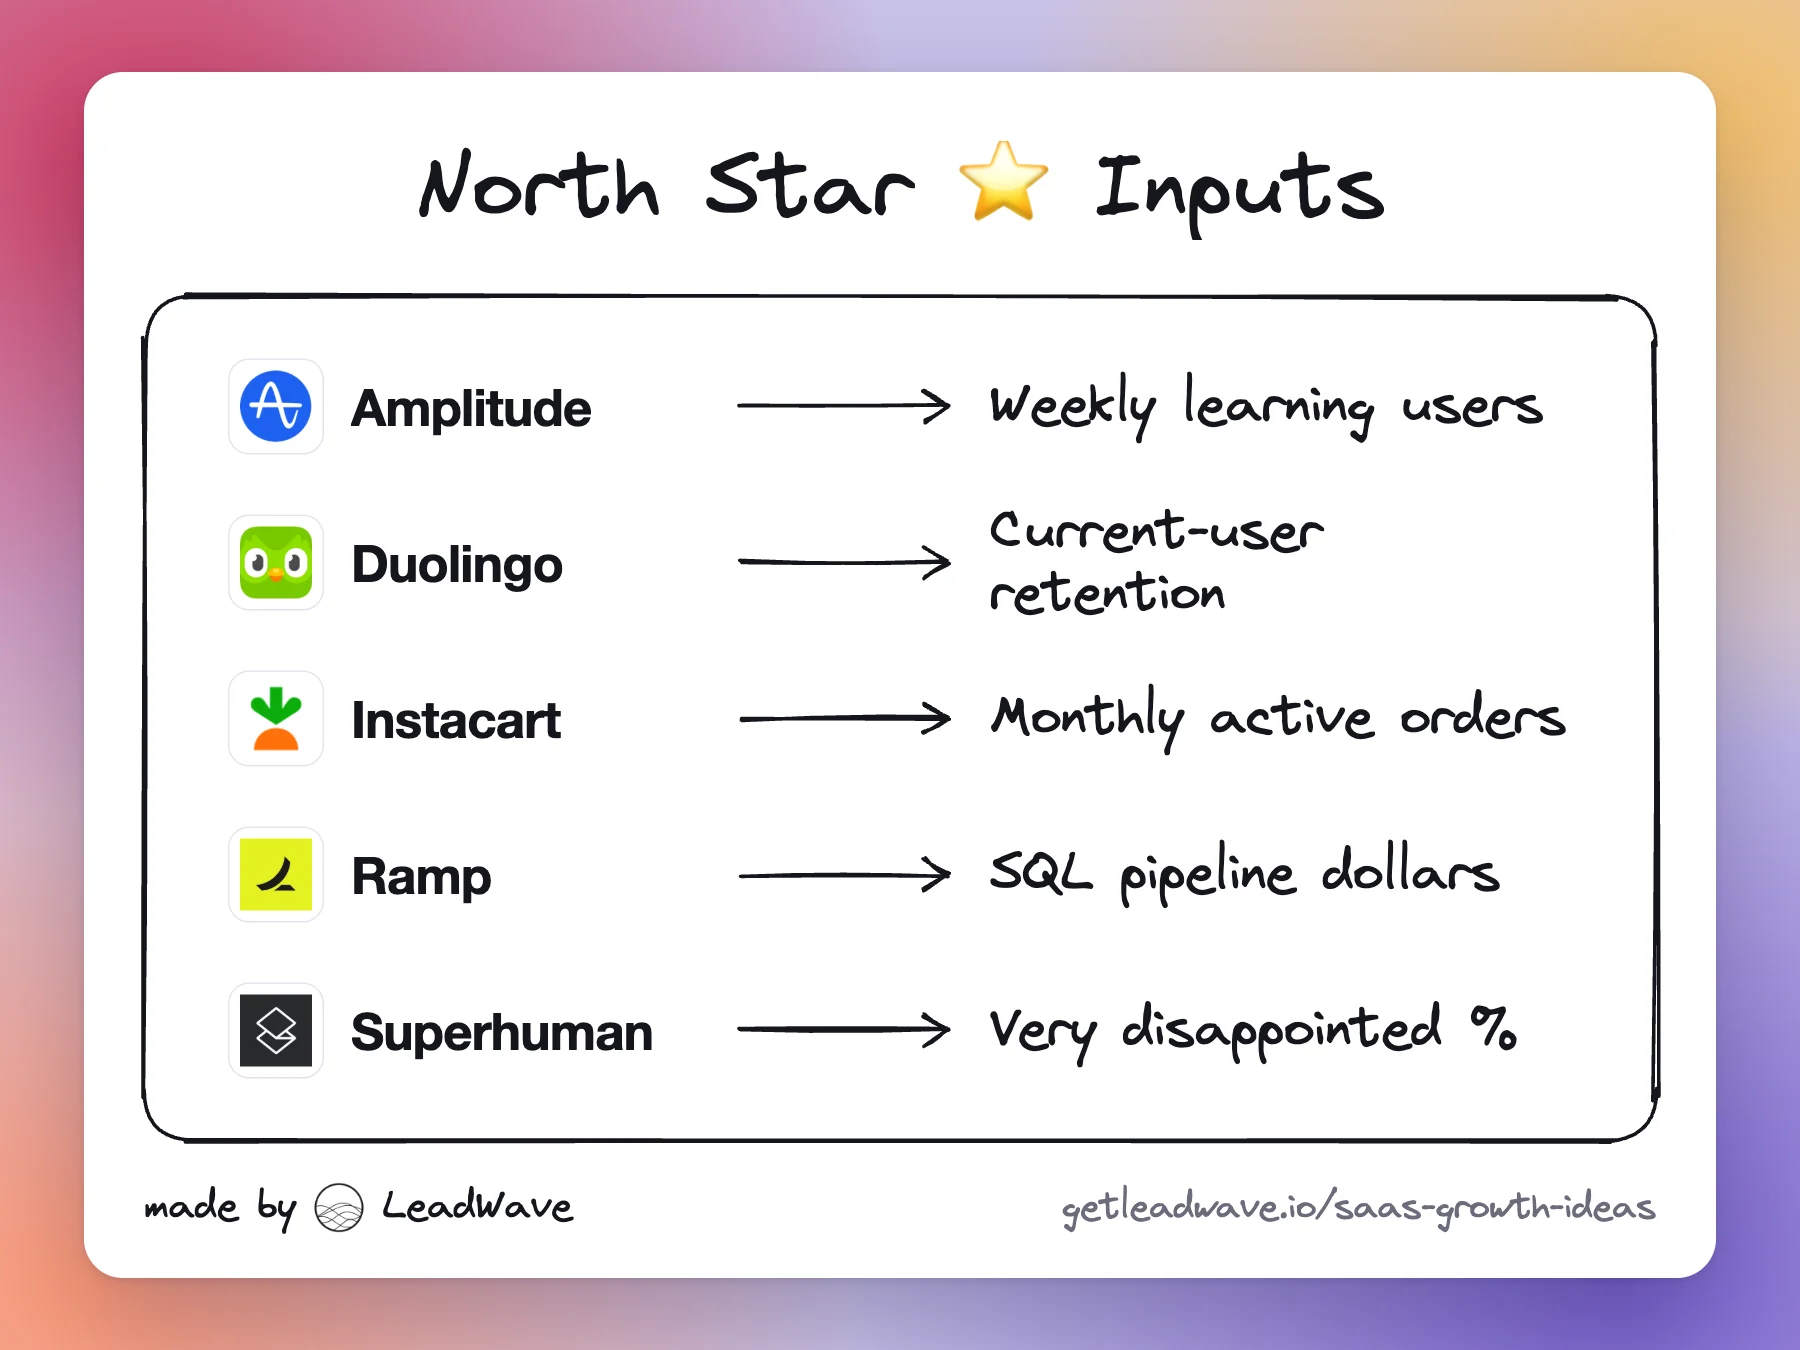
Before product-market fit, don't bother. Lenny's advice is to focus on whether enough people stick after using the product, which is cohort retention. Superhuman went further and made its product-market fit score its only key result for a while (see the examples below).
Build the input-metric tree
The north star is an output. You can't move it directly; you move the things that drive it. Those are your input metrics, typically three to five of them. John Cutler, co-author of Amplitude's North Star Playbook, puts it this way: “If you can move your North Star directly, it's probably not a good North Star.”
To build the tree, write the north star as a formula and break it into the factors your teams control. When Amplitude moved to weekly learning users (users who share a chart or dashboard that at least two other people consume in a week), it named three inputs: activated accounts (5+ weekly learning users), broadcast learnings and consumption of learnings.
The best trees come from data, not a whiteboard. Duolingo modeled daily active users as a set of user states (new, current, reactivated, resurrected, at-risk, dormant) with a retention rate between each. It then moved each rate by the same small amount in a simulation and found that current-user retention had five times the impact on DAU of the next-best lever. That told Duolingo which input to staff first.
A good input is:
- Controllable by one team through its normal work.
- Leading: it moves within days or weeks, not quarters.
- Connected: when it goes up, the north star goes up too, and you have checked that in your data.
Give every team an input it owns
Alignment happens when each team has a number it can move that clearly rolls up to the north star. Two ways to set that up:
- One input per team. Duolingo set up a dedicated Retention Team whose north star was current-user retention, while other teams worked on gamification, acquisition and social features. Over four years, current-user retention rose 21% and DAU grew 4.5x.
- A translation layer. At Instacart the north star for growth was monthly active orders, and each team kept a local metric it could influence directly, from checkout speed to acquisition. The finance and data team built a translation from every team's metric into monthly active orders, so projects, headcount and budget could be compared in one currency. Ramp does the same: for its growth team the north star was dollars of sales-qualified pipeline, so a landing-page test was judged by what its lift in conversion was worth in pipeline.
The rule behind both: hold people accountable for things they can influence, and make the link to the north star explicit. Sri Batchu, who led growth at Instacart and Ramp, recommends keeping it to one north star, two at most.
Marketing and sales need inputs too, not only product. Pipeline dollars, activated trials or accounts reaching the value moment are all inputs a go-to-market team can own.
Rituals that keep it alive
A north star announced at an all-hands and never discussed again changes nothing. It needs a cadence:
- Weekly input review. Amazon's Weekly Business Review is the extreme version: its executive team goes through 400 to 500 metrics in 60 minutes every Wednesday, focused on controllable input metrics. Output metrics are only reported, not debated, and owners skip anything within normal variation. Copy the shape, not the size: one owner per input, a trend chart, and a short note on anything unusual.
- Every project names its input. Planning docs and experiment briefs say which input they move and by how much, so priorities can be compared.
- Monthly north star readout. Share the number, the inputs and what moved them with the whole company.
- Quarterly sanity check. Is the north star still predicting revenue and retention? Ted Clark of Amplitude: “If your North Star is flat, then expect your revenue to be flat. But if at any point your North Star isn't directionally indicating where your revenue is going, then it's time to revise it.”
Common failures
- A vanity metric. Page views, sign-ups, registered users and downloads go up without customers getting more value. Amplitude lists all of them as bad north stars.
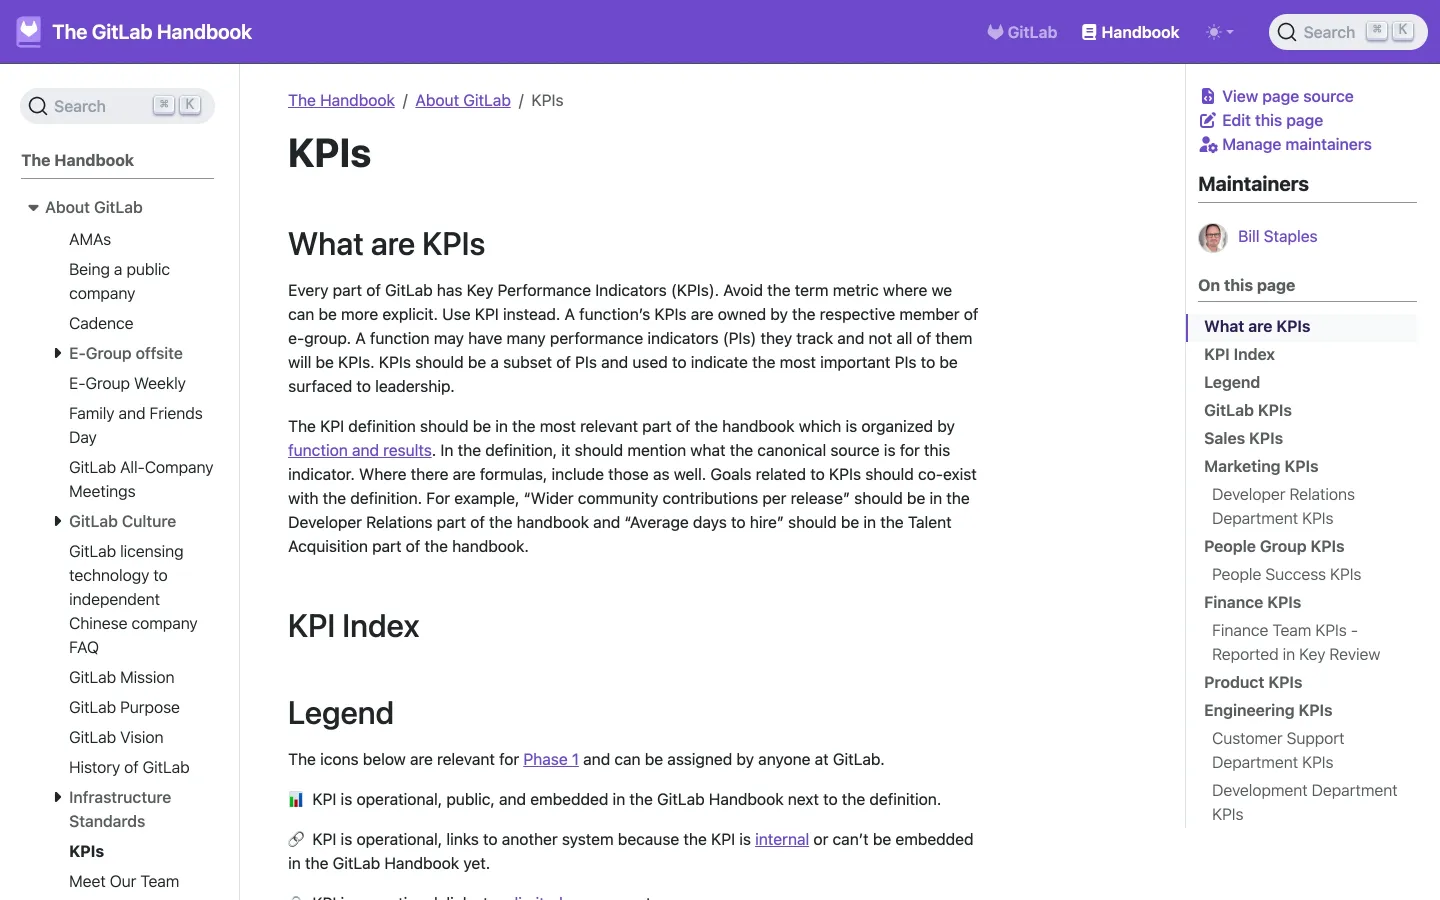
- Revenue as the north star. About half the companies in Lenny Rachitsky's survey focus on revenue, and it is tempting because everyone understands it. But revenue is lagging, spiky and hard for a product team to move week to week. Relate the north star to revenue; don't make it revenue. Some companies do it anyway: GitLab's public handbook names run-rate revenue as its north star, alongside ten other top KPIs reviewed by its board.
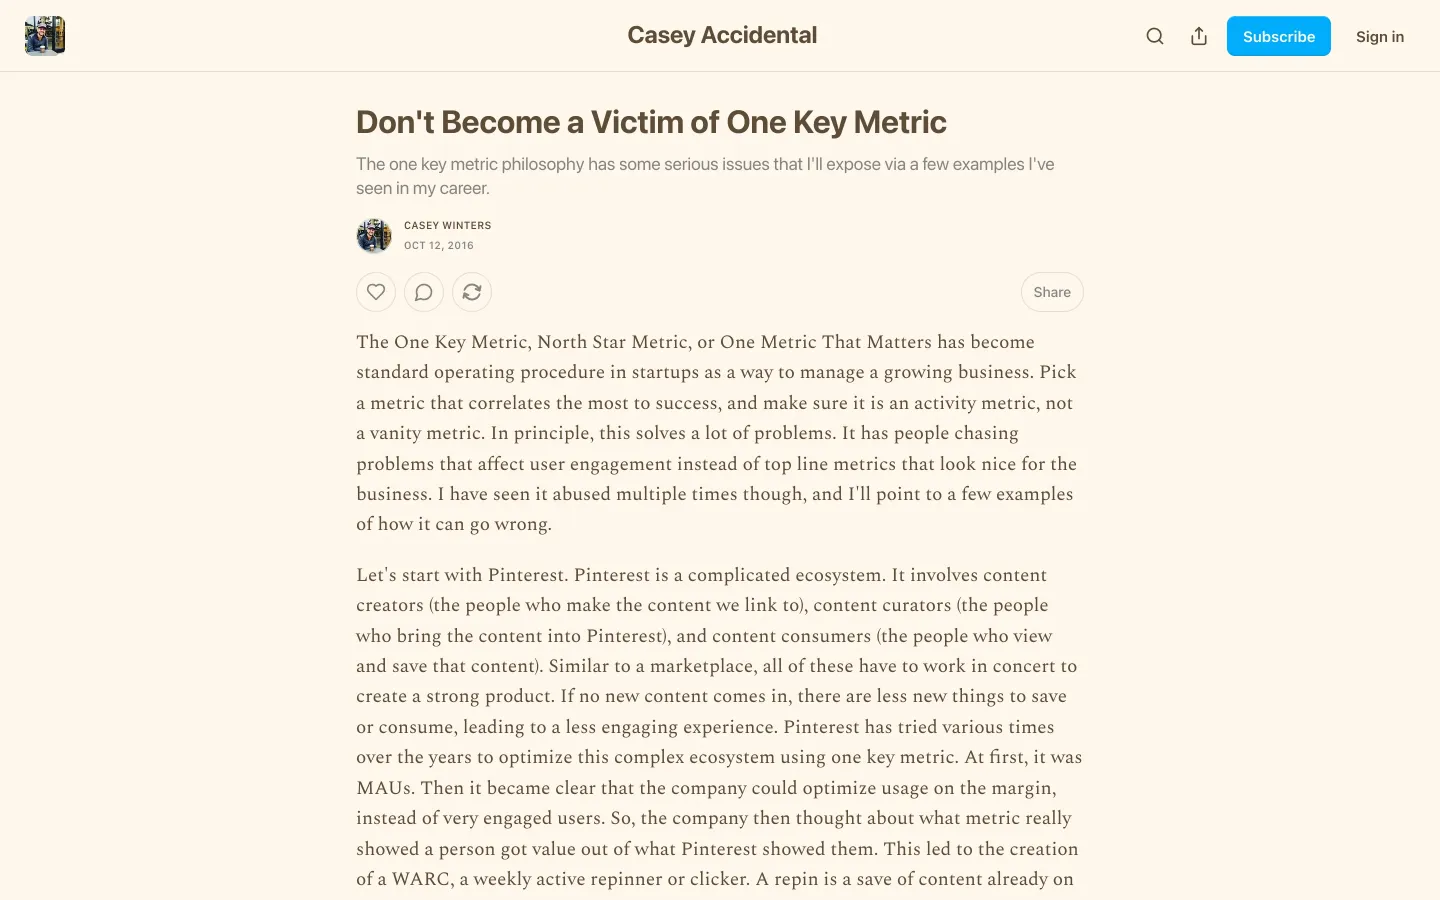
- A composite that hides trade-offs. Pinterest once used weekly active repinners or clickers. Casey Winters, who led growth there, called the combined metric “false rigor”: an experiment could trade repins for clicks and still look like a win, and the supply side (new content) was ignored.
- Too many north stars. Five “north stars” is a KPI dashboard. Pick one; add a guardrail metric (quality, churn, satisfaction) if you fear it being gamed.
- Inputs nobody owns. If no team's plan names an input, the tree is decoration.
- Never revisiting it. Strategy changes; a metric chosen at 20 people may be wrong at 200.
When to change your north star
Changing the north star is normal. Amplitude says it has changed its own at least three times. Common triggers:
- The business model shifts. Dropbox centered on monthly active users early on, then moved to paid customer growth as it went from consumer to B2B.
- The metric stops predicting value. Amplitude dropped weekly querying users when it saw that counting individual queriers limited its product to one persona, and moved to weekly learning users, which reward sharing insights across a team.
- The company decides what kind of engagement it wants. In January 2018 Mark Zuckerberg changed the goal for Facebook's product teams to meaningful social interactions, and said to expect time spent to fall.
- Product-market fit is reached. A pre-fit metric like Superhuman's “very disappointed” percentage gives way to a growth metric.
When you change it, say why, keep reporting the old metric for a quarter so people can see the overlap, and rebuild the input tree before you announce it.