
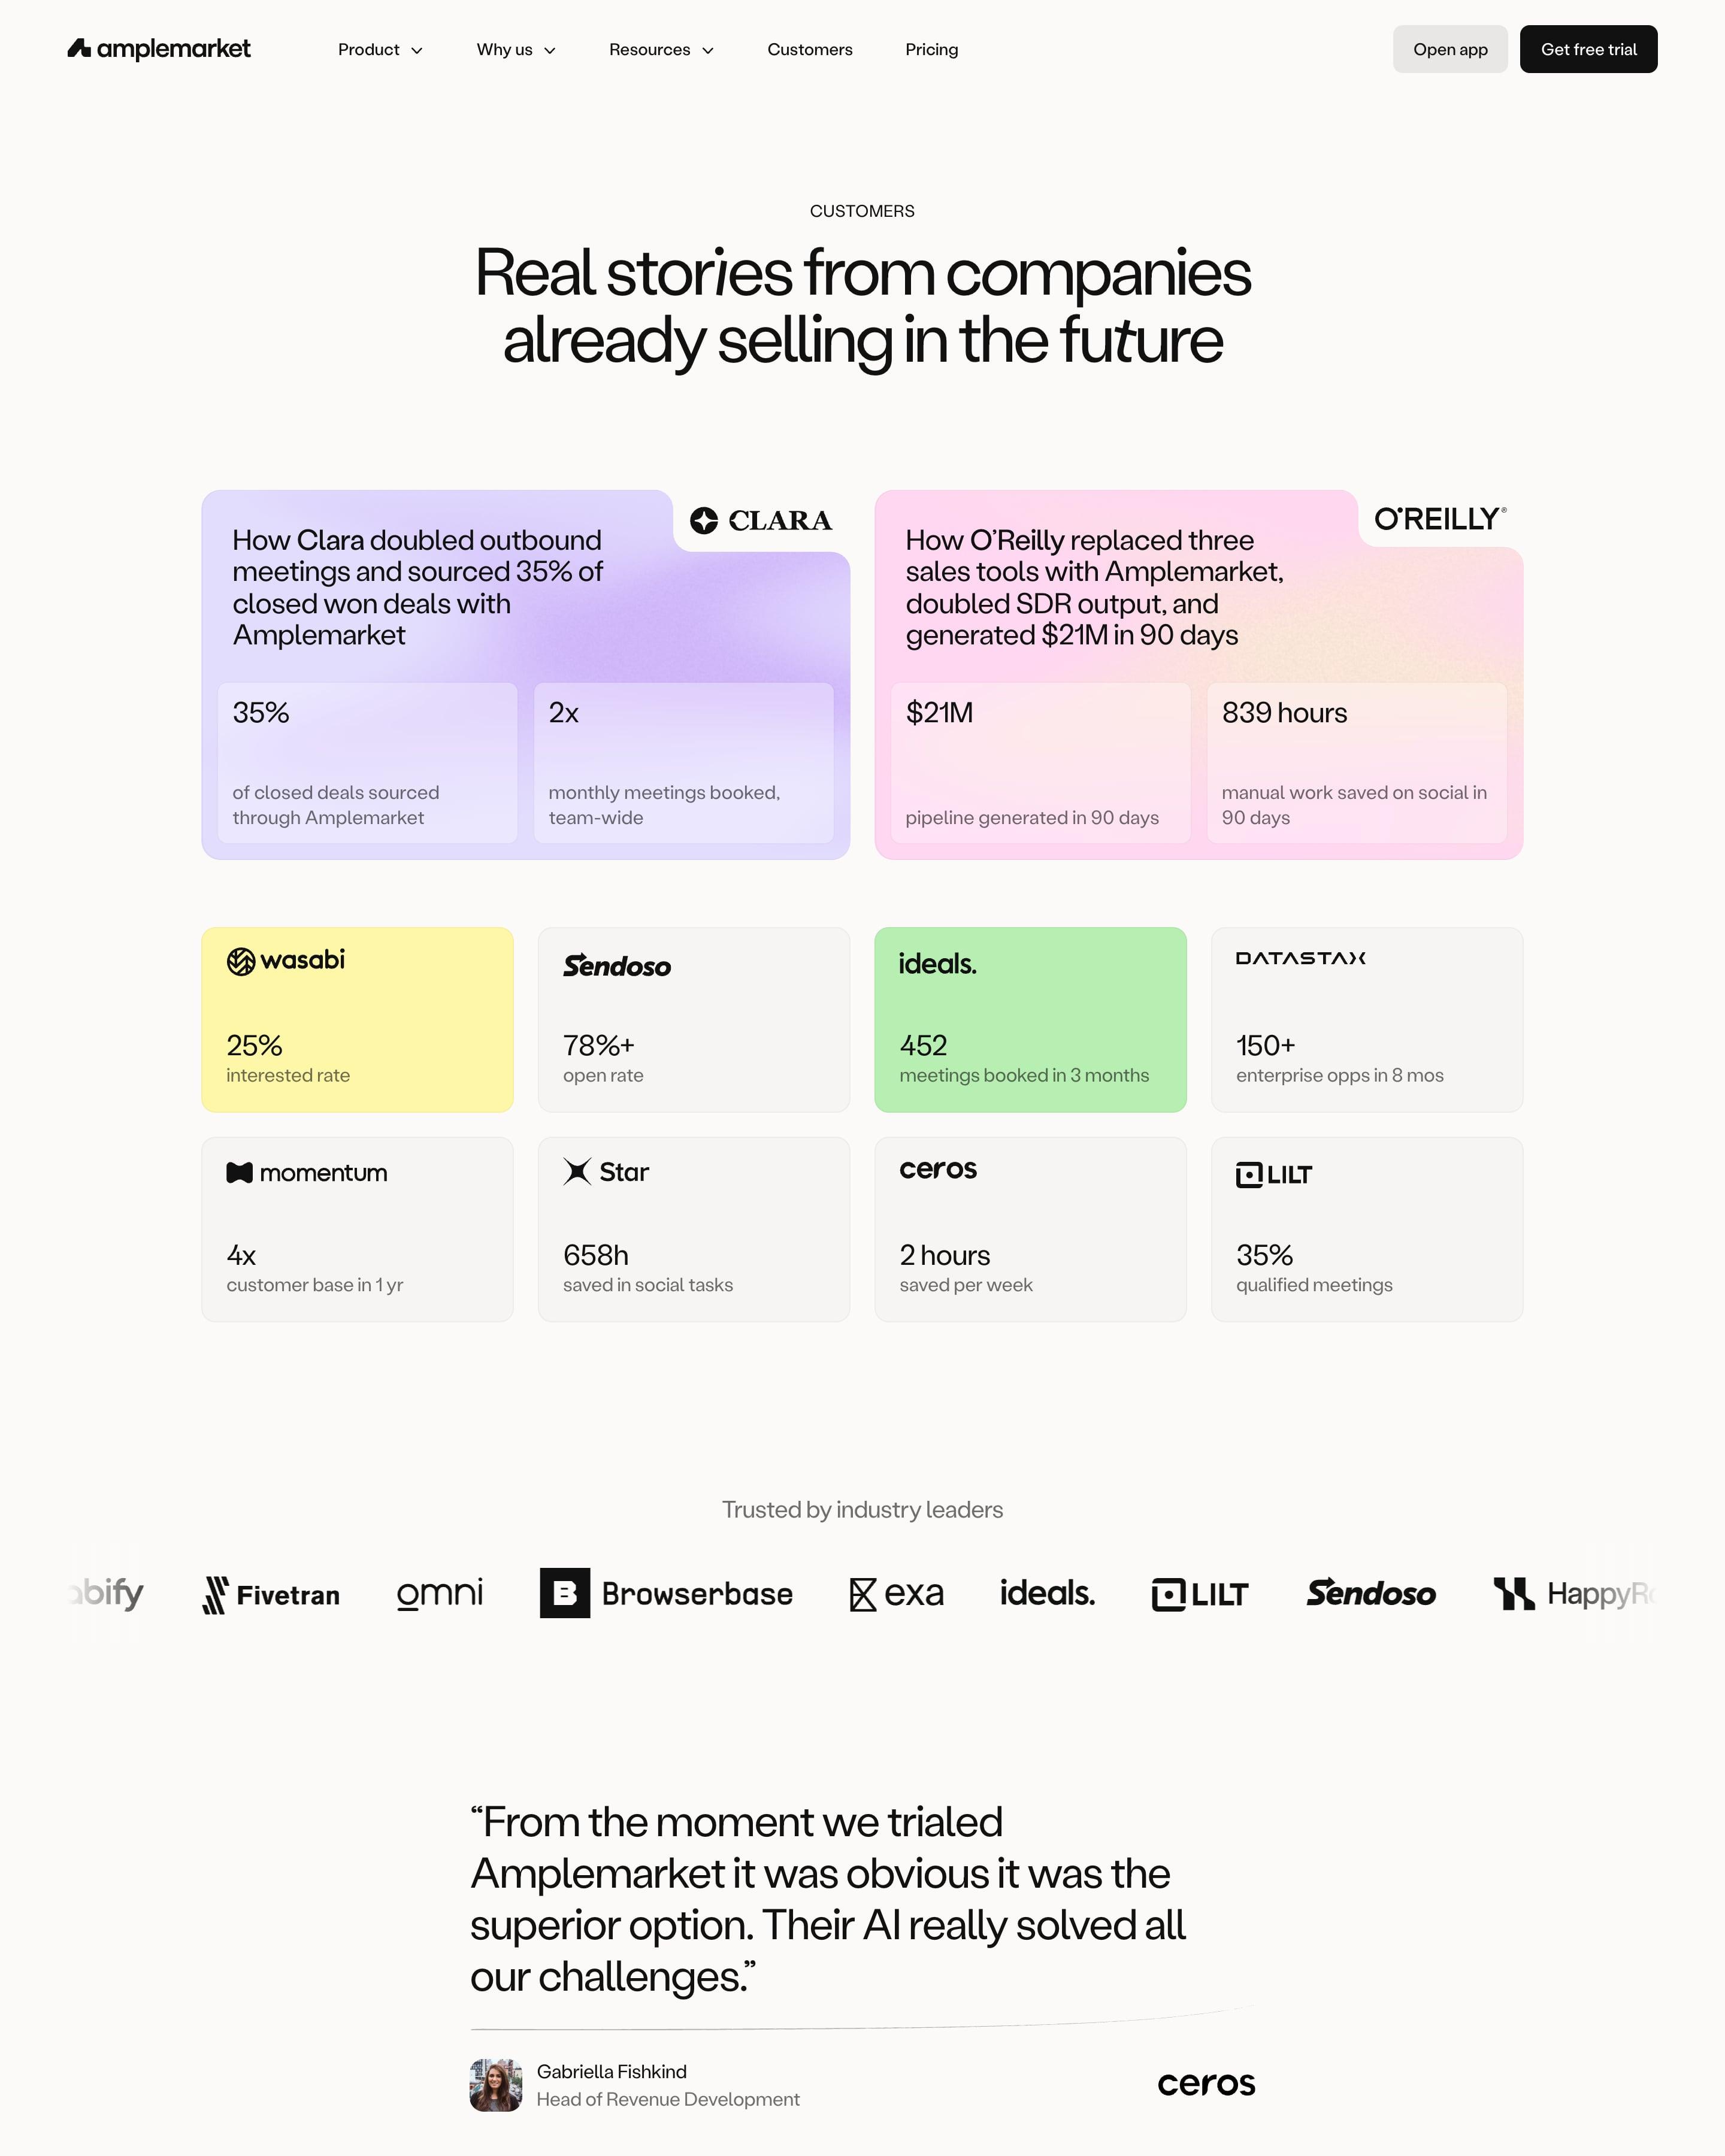

Two story cards for Clara and O'Reilly lead, each with a logo tab cut into a lilac or pink gradient corner and two stat boxes. Eight smaller tiles follow, some tinted yellow or green, each just a logo and one number. The rest is a filterable list of customers with industry tags, and ending it on a black "Your company" row with a trial button is a neat touch.
54 examples
Best SaaS Customer Stories Page Examples
Customer and case study pages from SaaS companies known for their design: how they show logos, results and the stories behind them.
- Dark or light
- 10 dark, 44 light
- of 54 pages
- Heading fonts
- Inter
- Inter 5, Geist 2, Labil Grotesk 1, Clash Grotesk 1
- Built with
- Next.js
- Next.js 32, Webflow 9, Framer 6, Astro 2
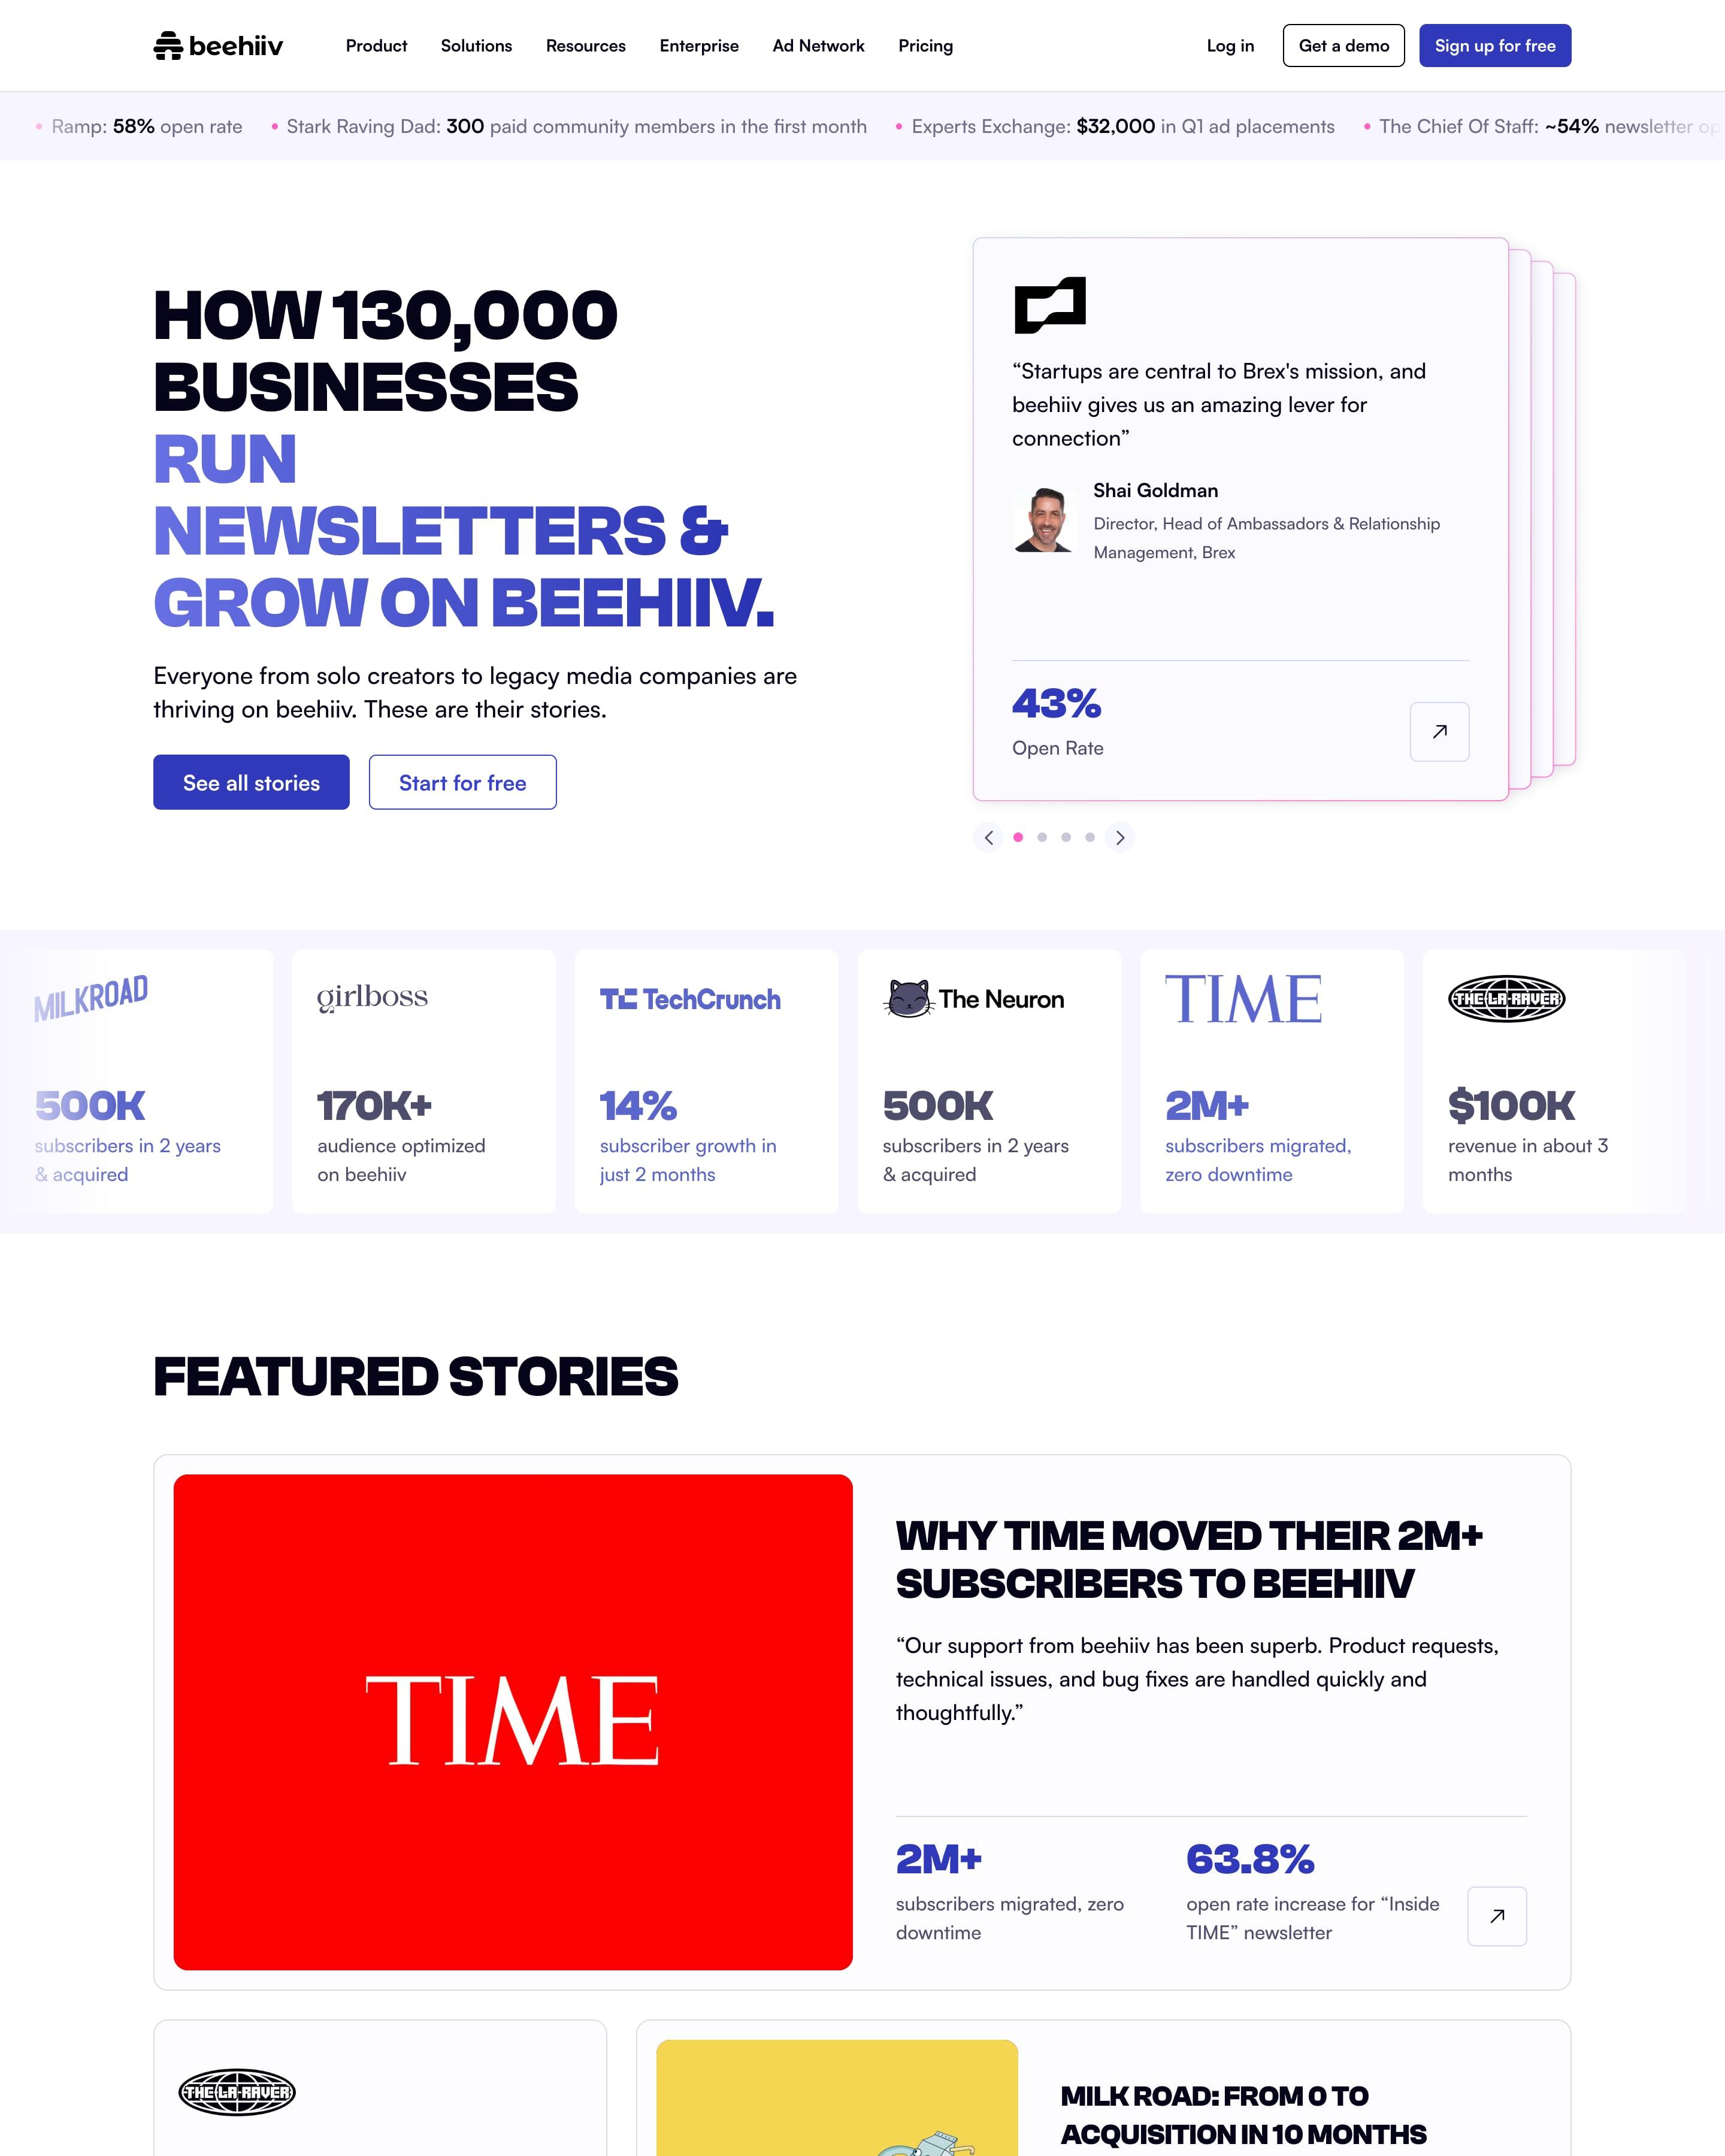
A ticker of customer results runs across the top, and each card in the hero's stacked carousel ends in one number, like a 43% open rate. Logo tiles and story cards follow the same rule, and the story grid adds search, a filter and numbered pages. The results ticker is the piece to copy.
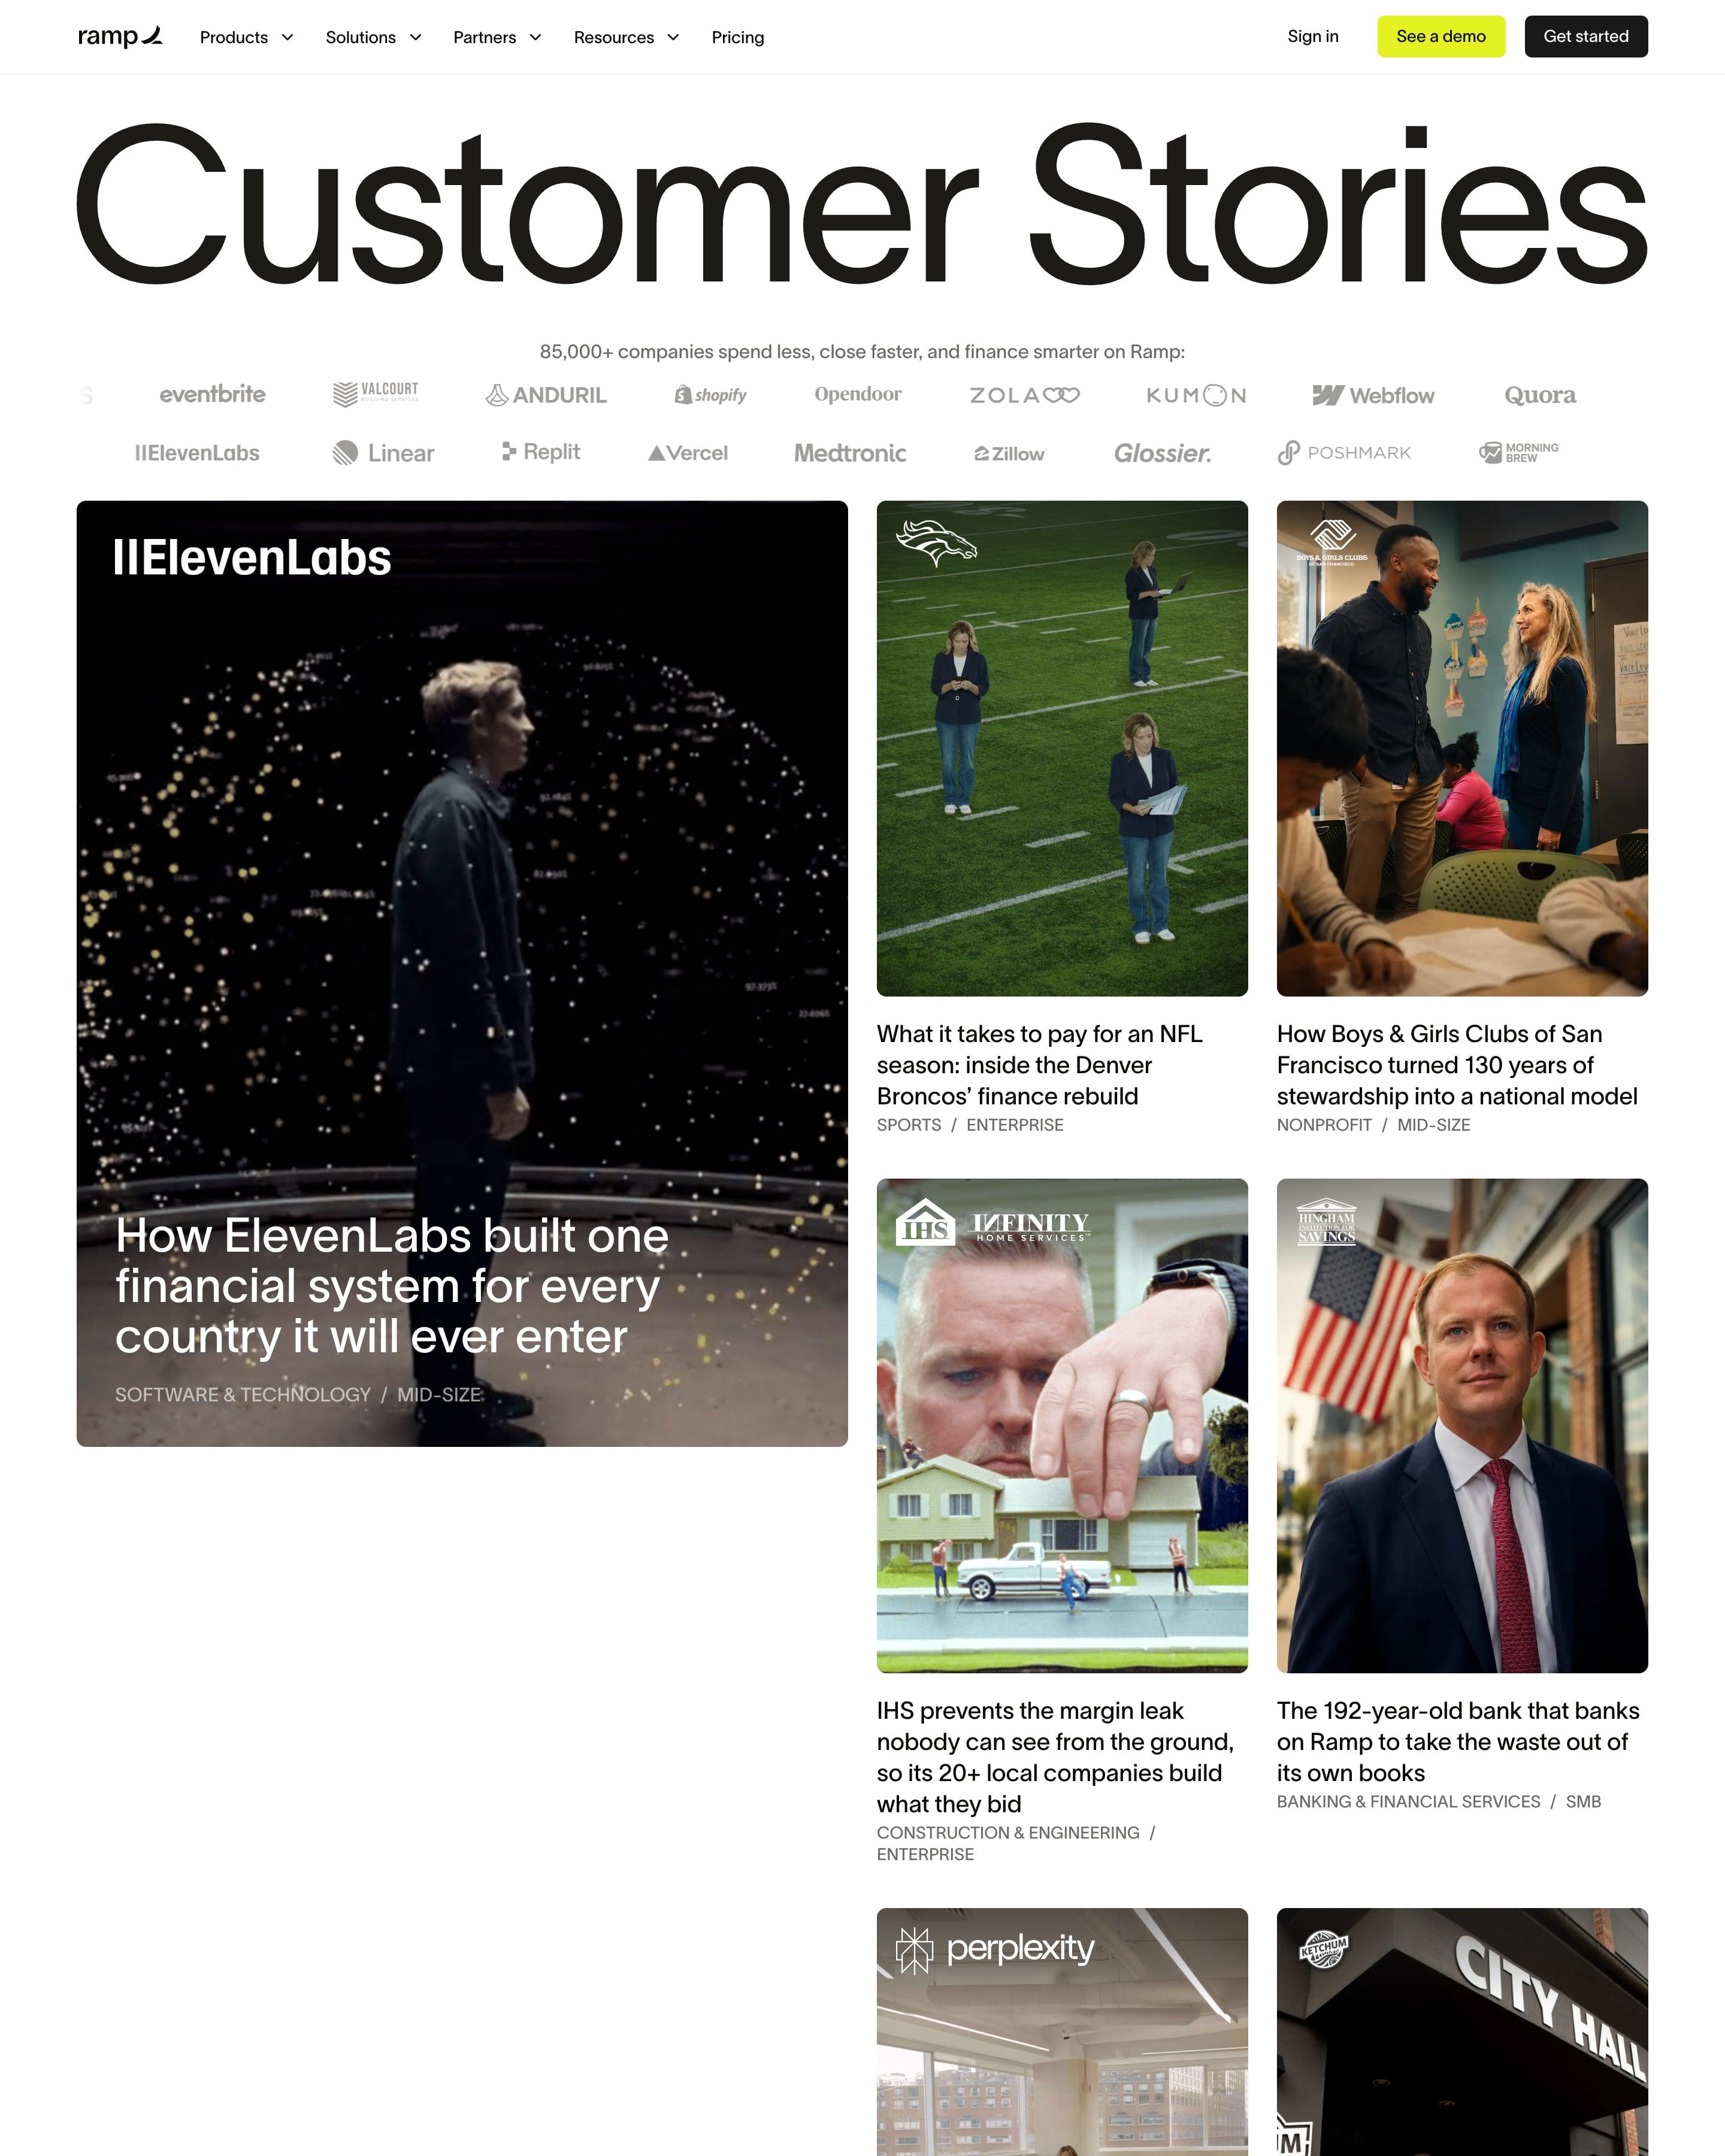
"Customer Stories" is set huge across the full width, over two rows of customer logos. ElevenLabs leads as a tall dark portrait card with smaller photo stories stacked beside it, then a full-bleed colourful photo carries a quote and a logo carousel. "All stories" closes with search, three filter dropdowns and logo cards on a pale blue gradient.
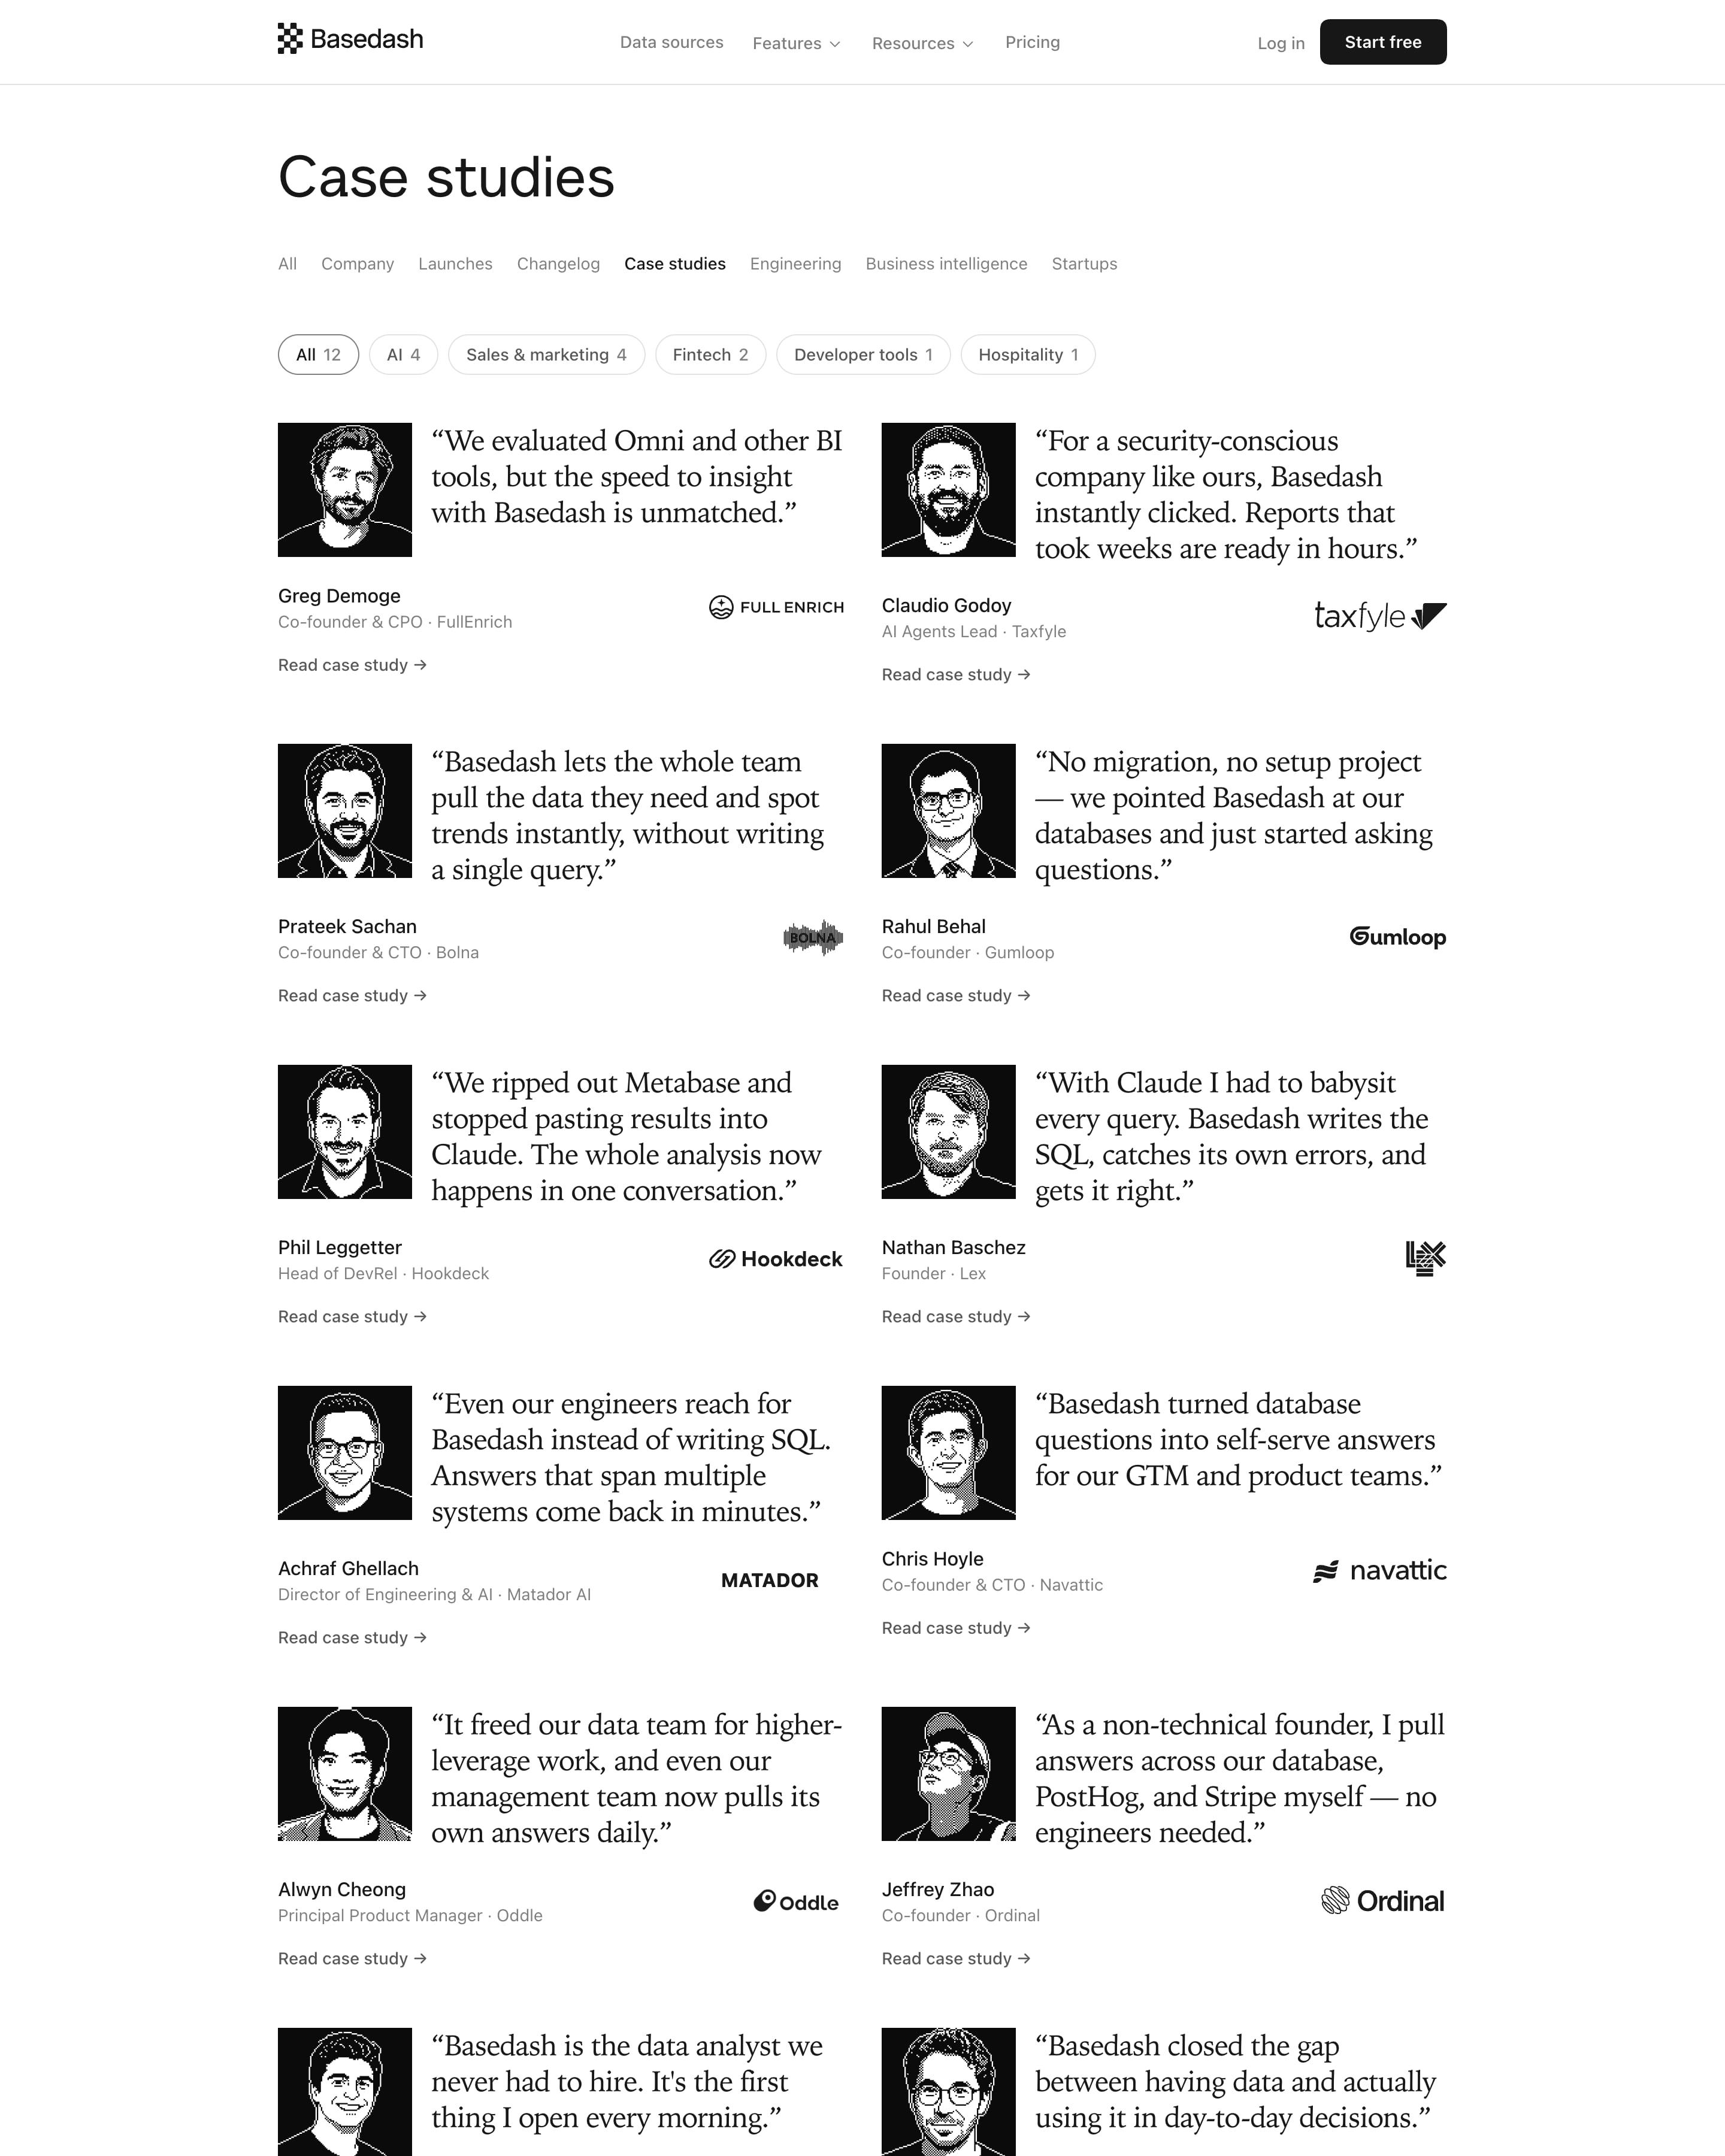
Twelve case studies in two columns, each an engraved black-and-white portrait beside a large serif quote, with name, title and company logo below. Filter pills like "AI 4" and "Fintech 2" show counts, and the page lives as a tab in the blog's category row. One illustration style for every customer keeps the grid consistent.
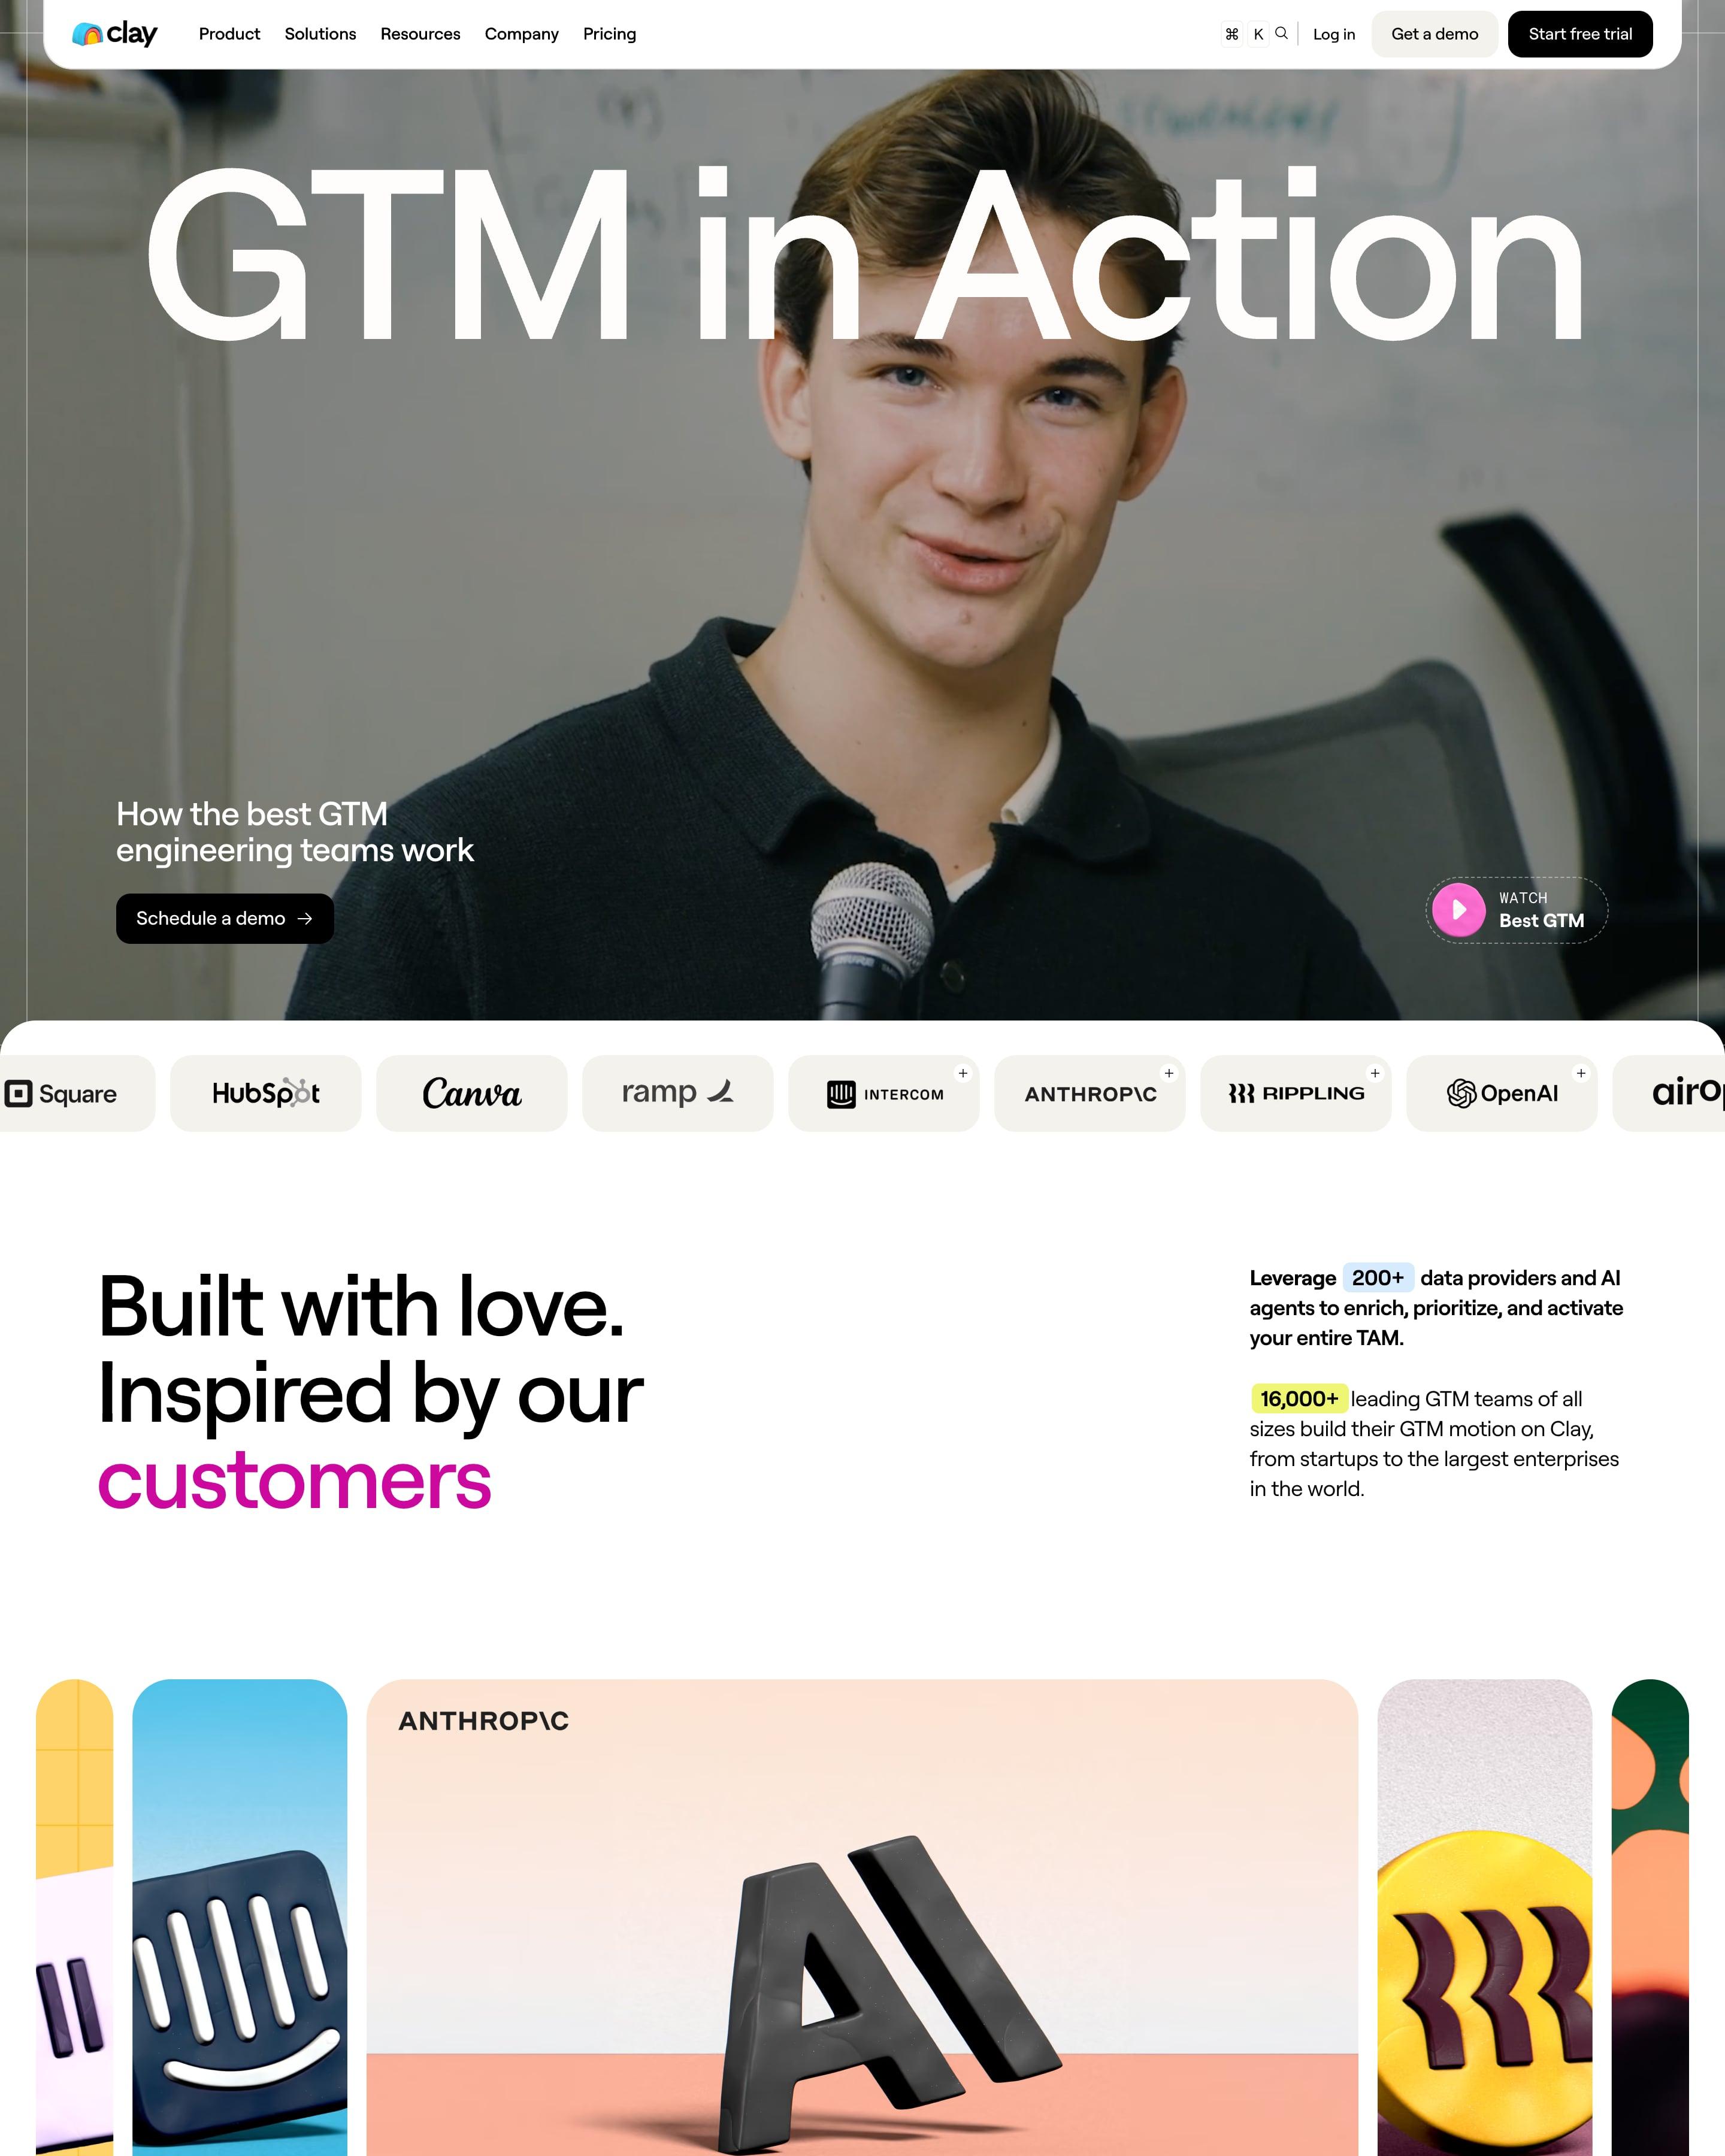
A full-bleed photo with "GTM in Action" across it opens the page, plus a "Watch" button. Stories then fill a grid of bright tiles, each led by a big stat, a quote or a 3D object. The filters sit on stacked coloured tabs for role and use case, an idea to lift.
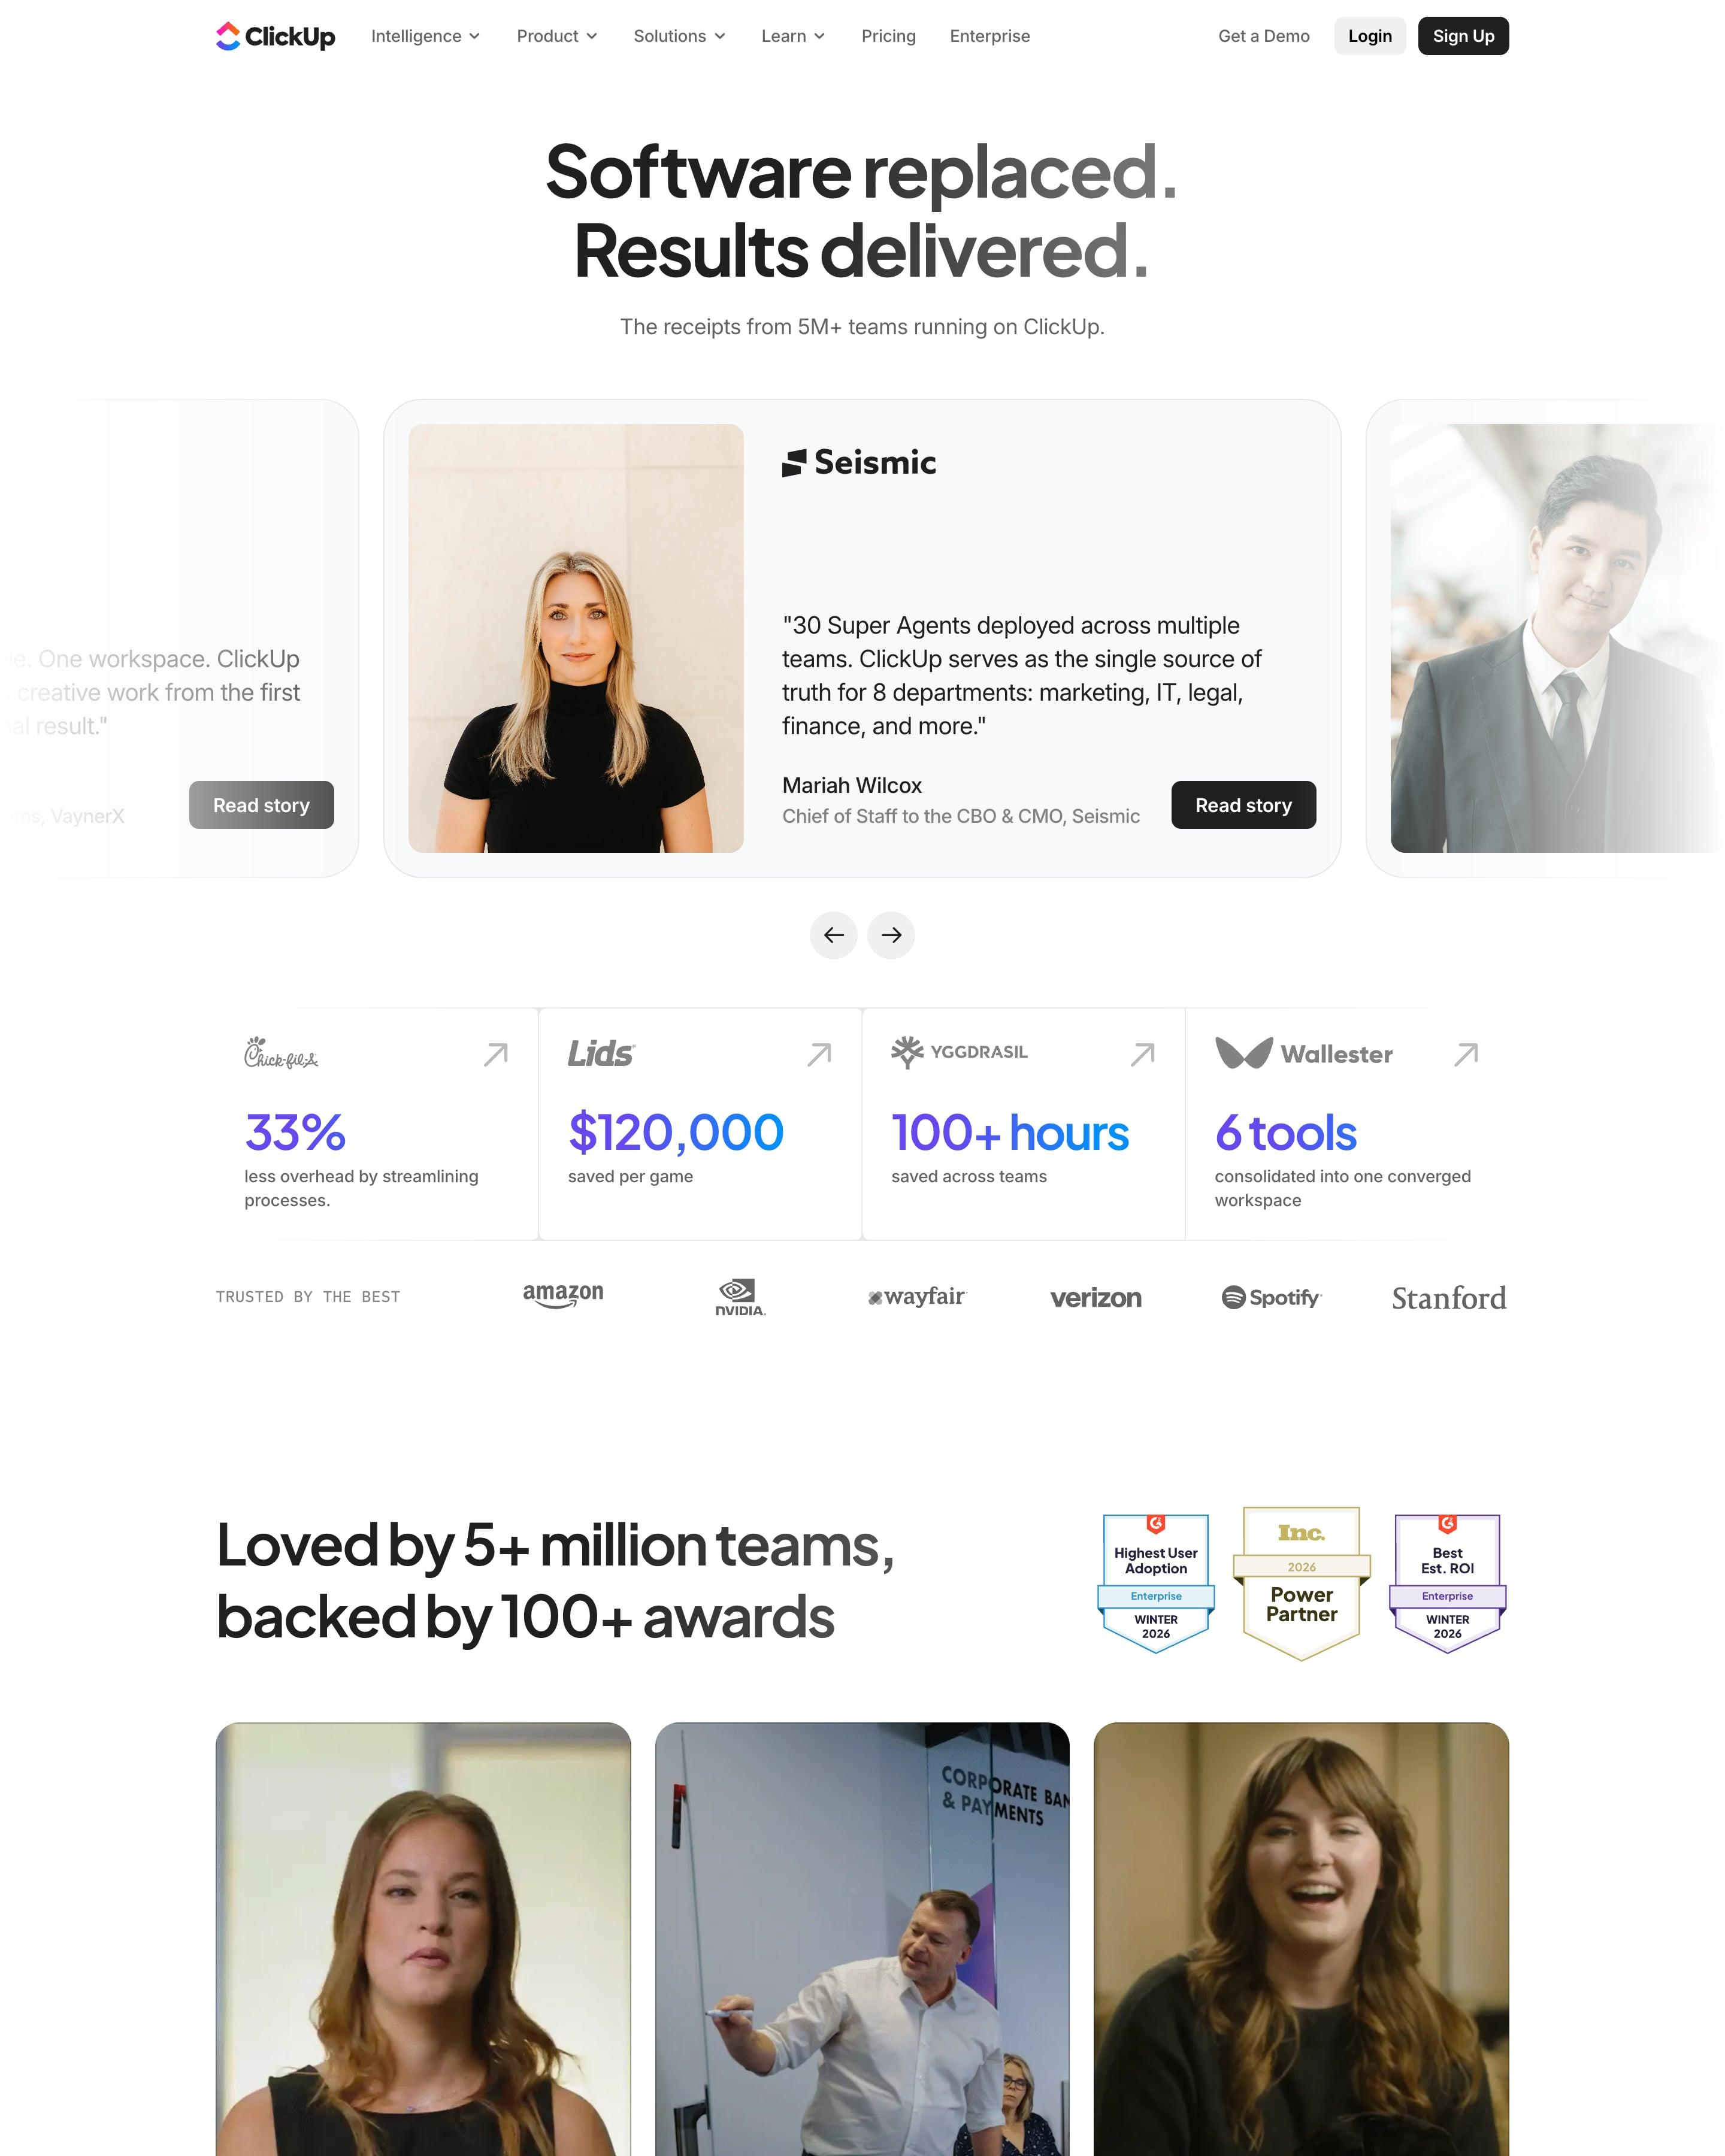
"Software replaced. Results delivered." opens on a carousel of story cards, Seismic's "30 Super Agents deployed" in the middle. Under it, four logo cells each lead with one outcome in gradient numerals: 33%, $120,000, 100+ hours, 6 tools. The story grid gives every customer a banner in its own brand colour, Miami red to Pressed olive, with the quote set small underneath.
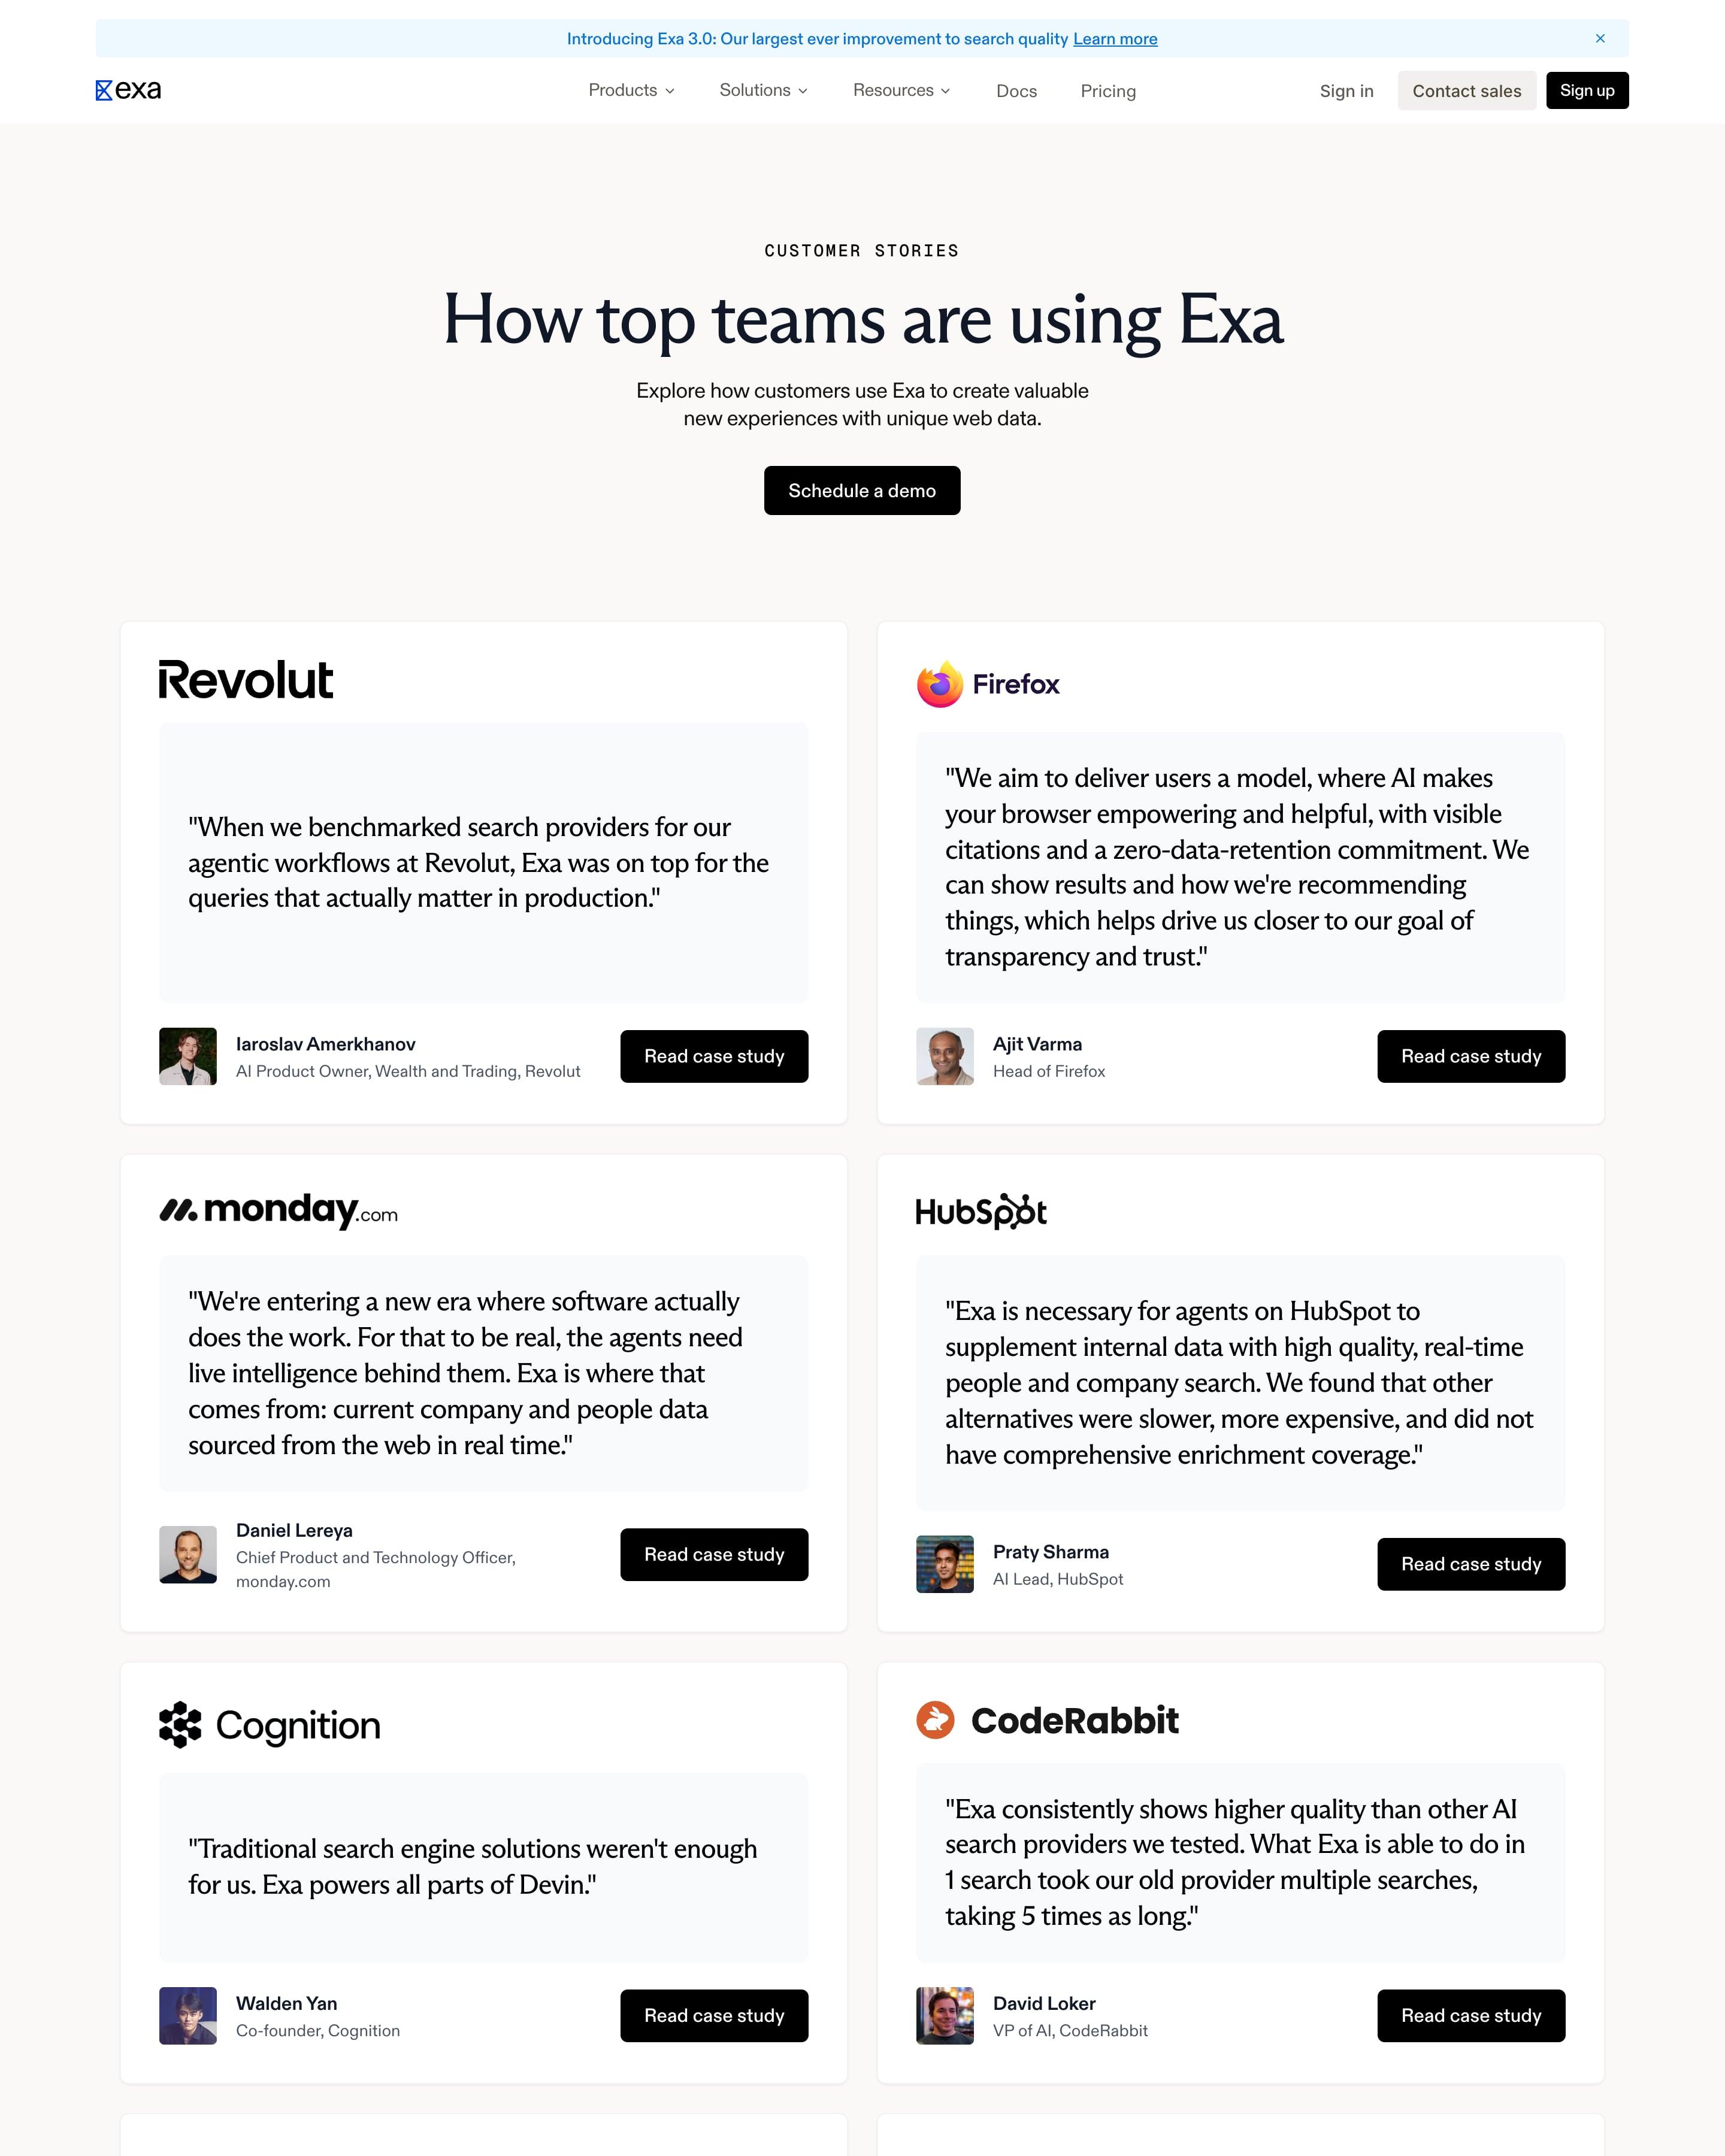
Under "How top teams are using Exa", fourteen white cards on a warm grey background repeat one pattern: company logo, a large quote in a pale inset box, then a small headshot, name, title and a black "Read case study" button. Revolut, Firefox, monday.com and HubSpot lead. The quotes lean on comparisons, like "Exa was on top" and "30% more often than any other tool".
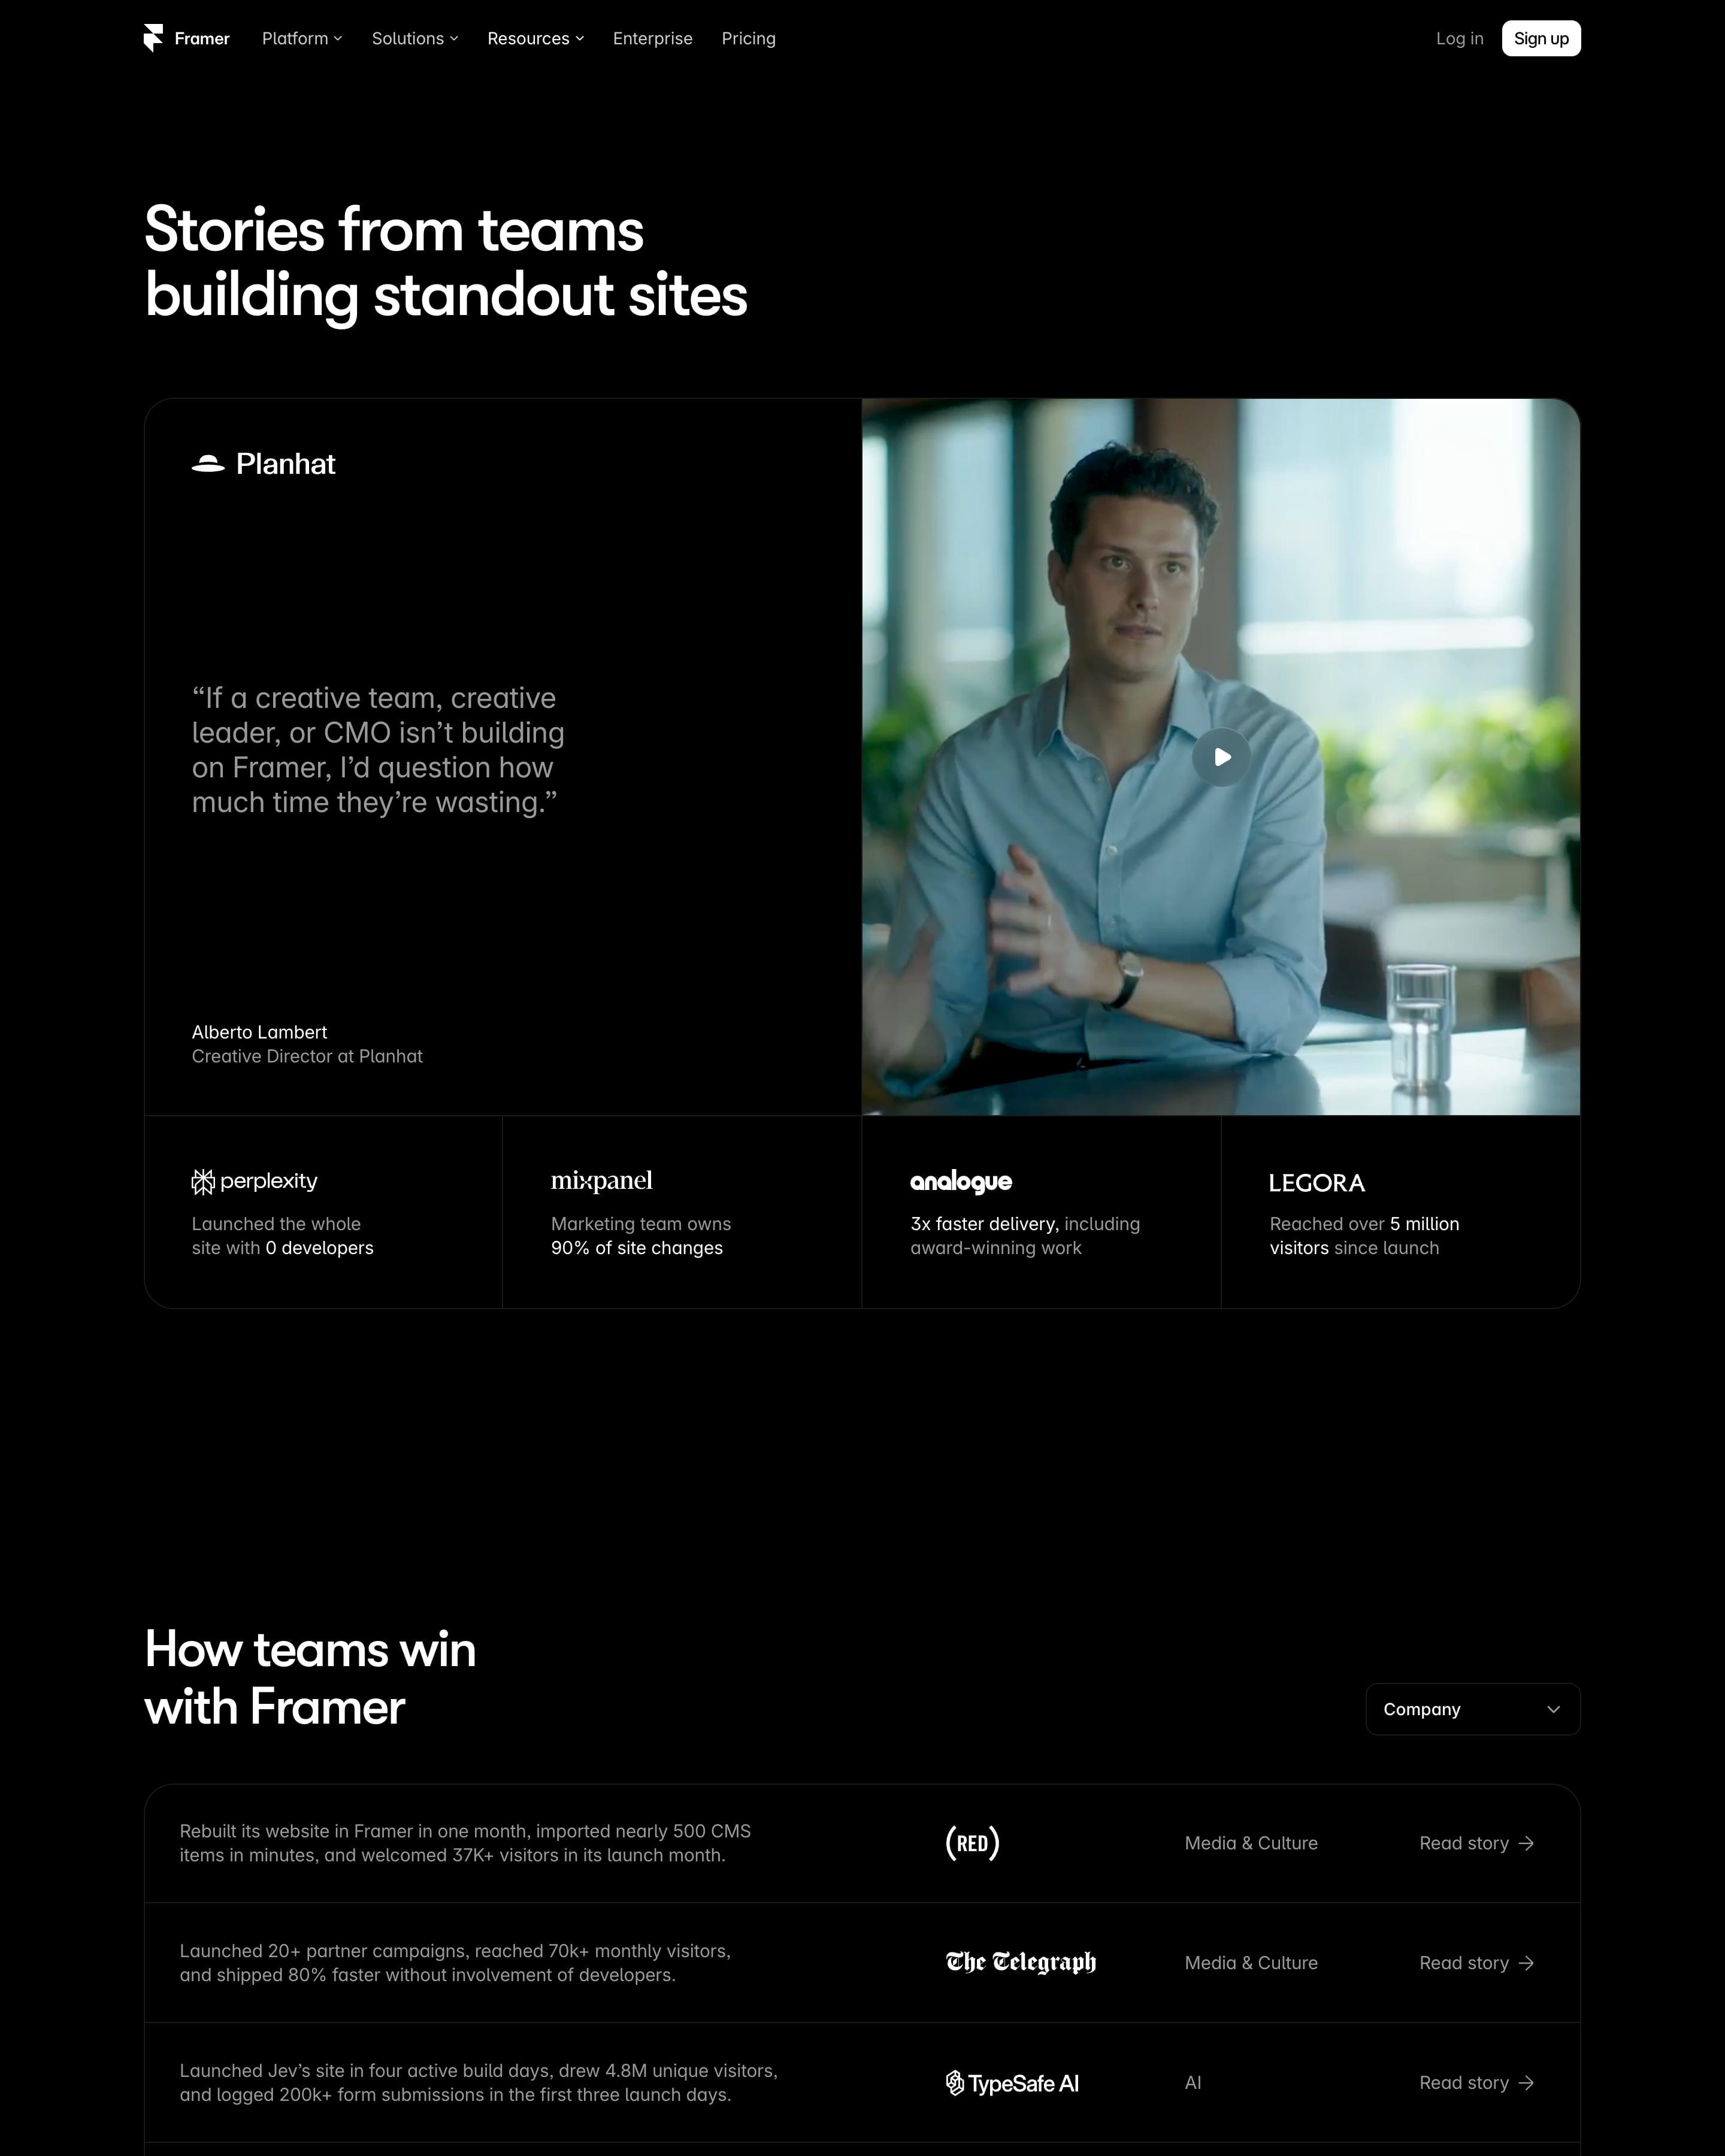
"Stories from teams building standout sites" opens on a Planhat video quote with four result tiles beneath, such as Perplexity's "Launched the whole site with 0 developers". "How teams win with Framer" is a table of one-line results, logo, industry and a Read story link. Big agency site screenshots (the Neue Montreal travel guide, Joby) lead into a four-column logo wall.
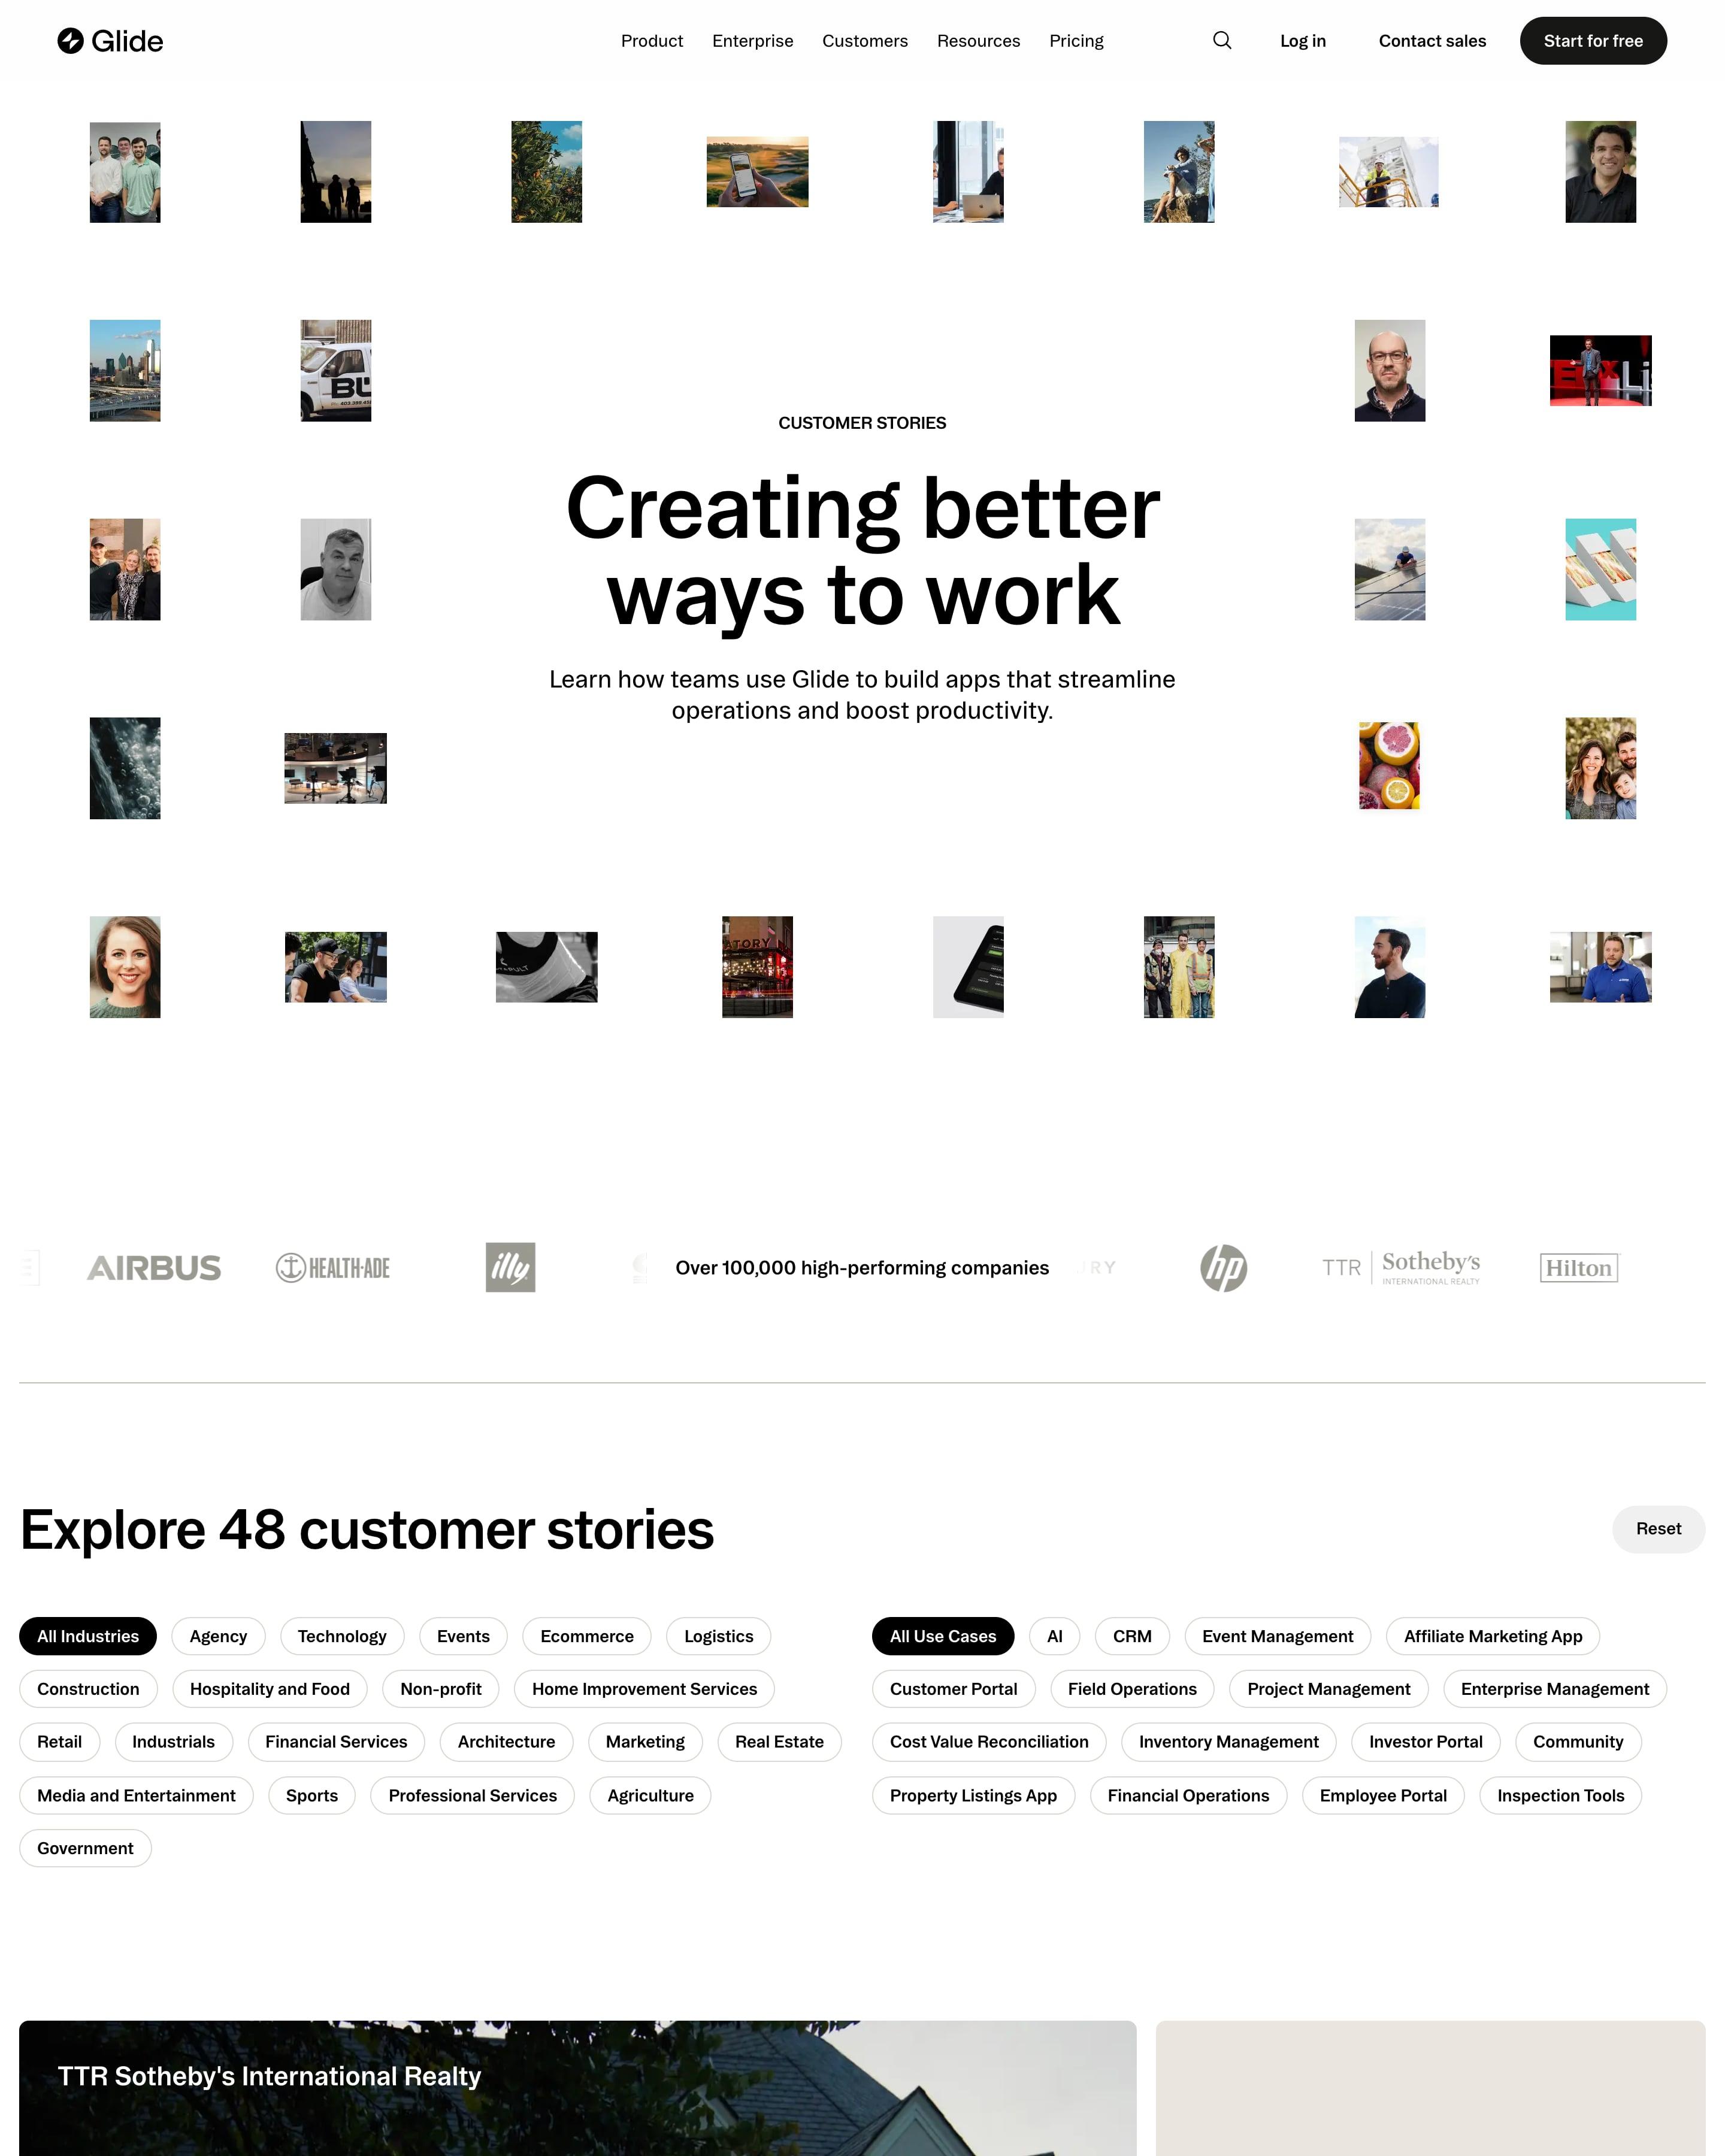
"Creating better ways to work" is ringed by a loose grid of small customer photos and portraits. Below "Explore 48 customer stories" sit two sets of filter pills, industry and use case, then a mixed grid of photo cards, quote cards and a green 750% card for YetiPay. "The numbers speak for themselves" sets 7M, 1.5K and 10x in a large serif.
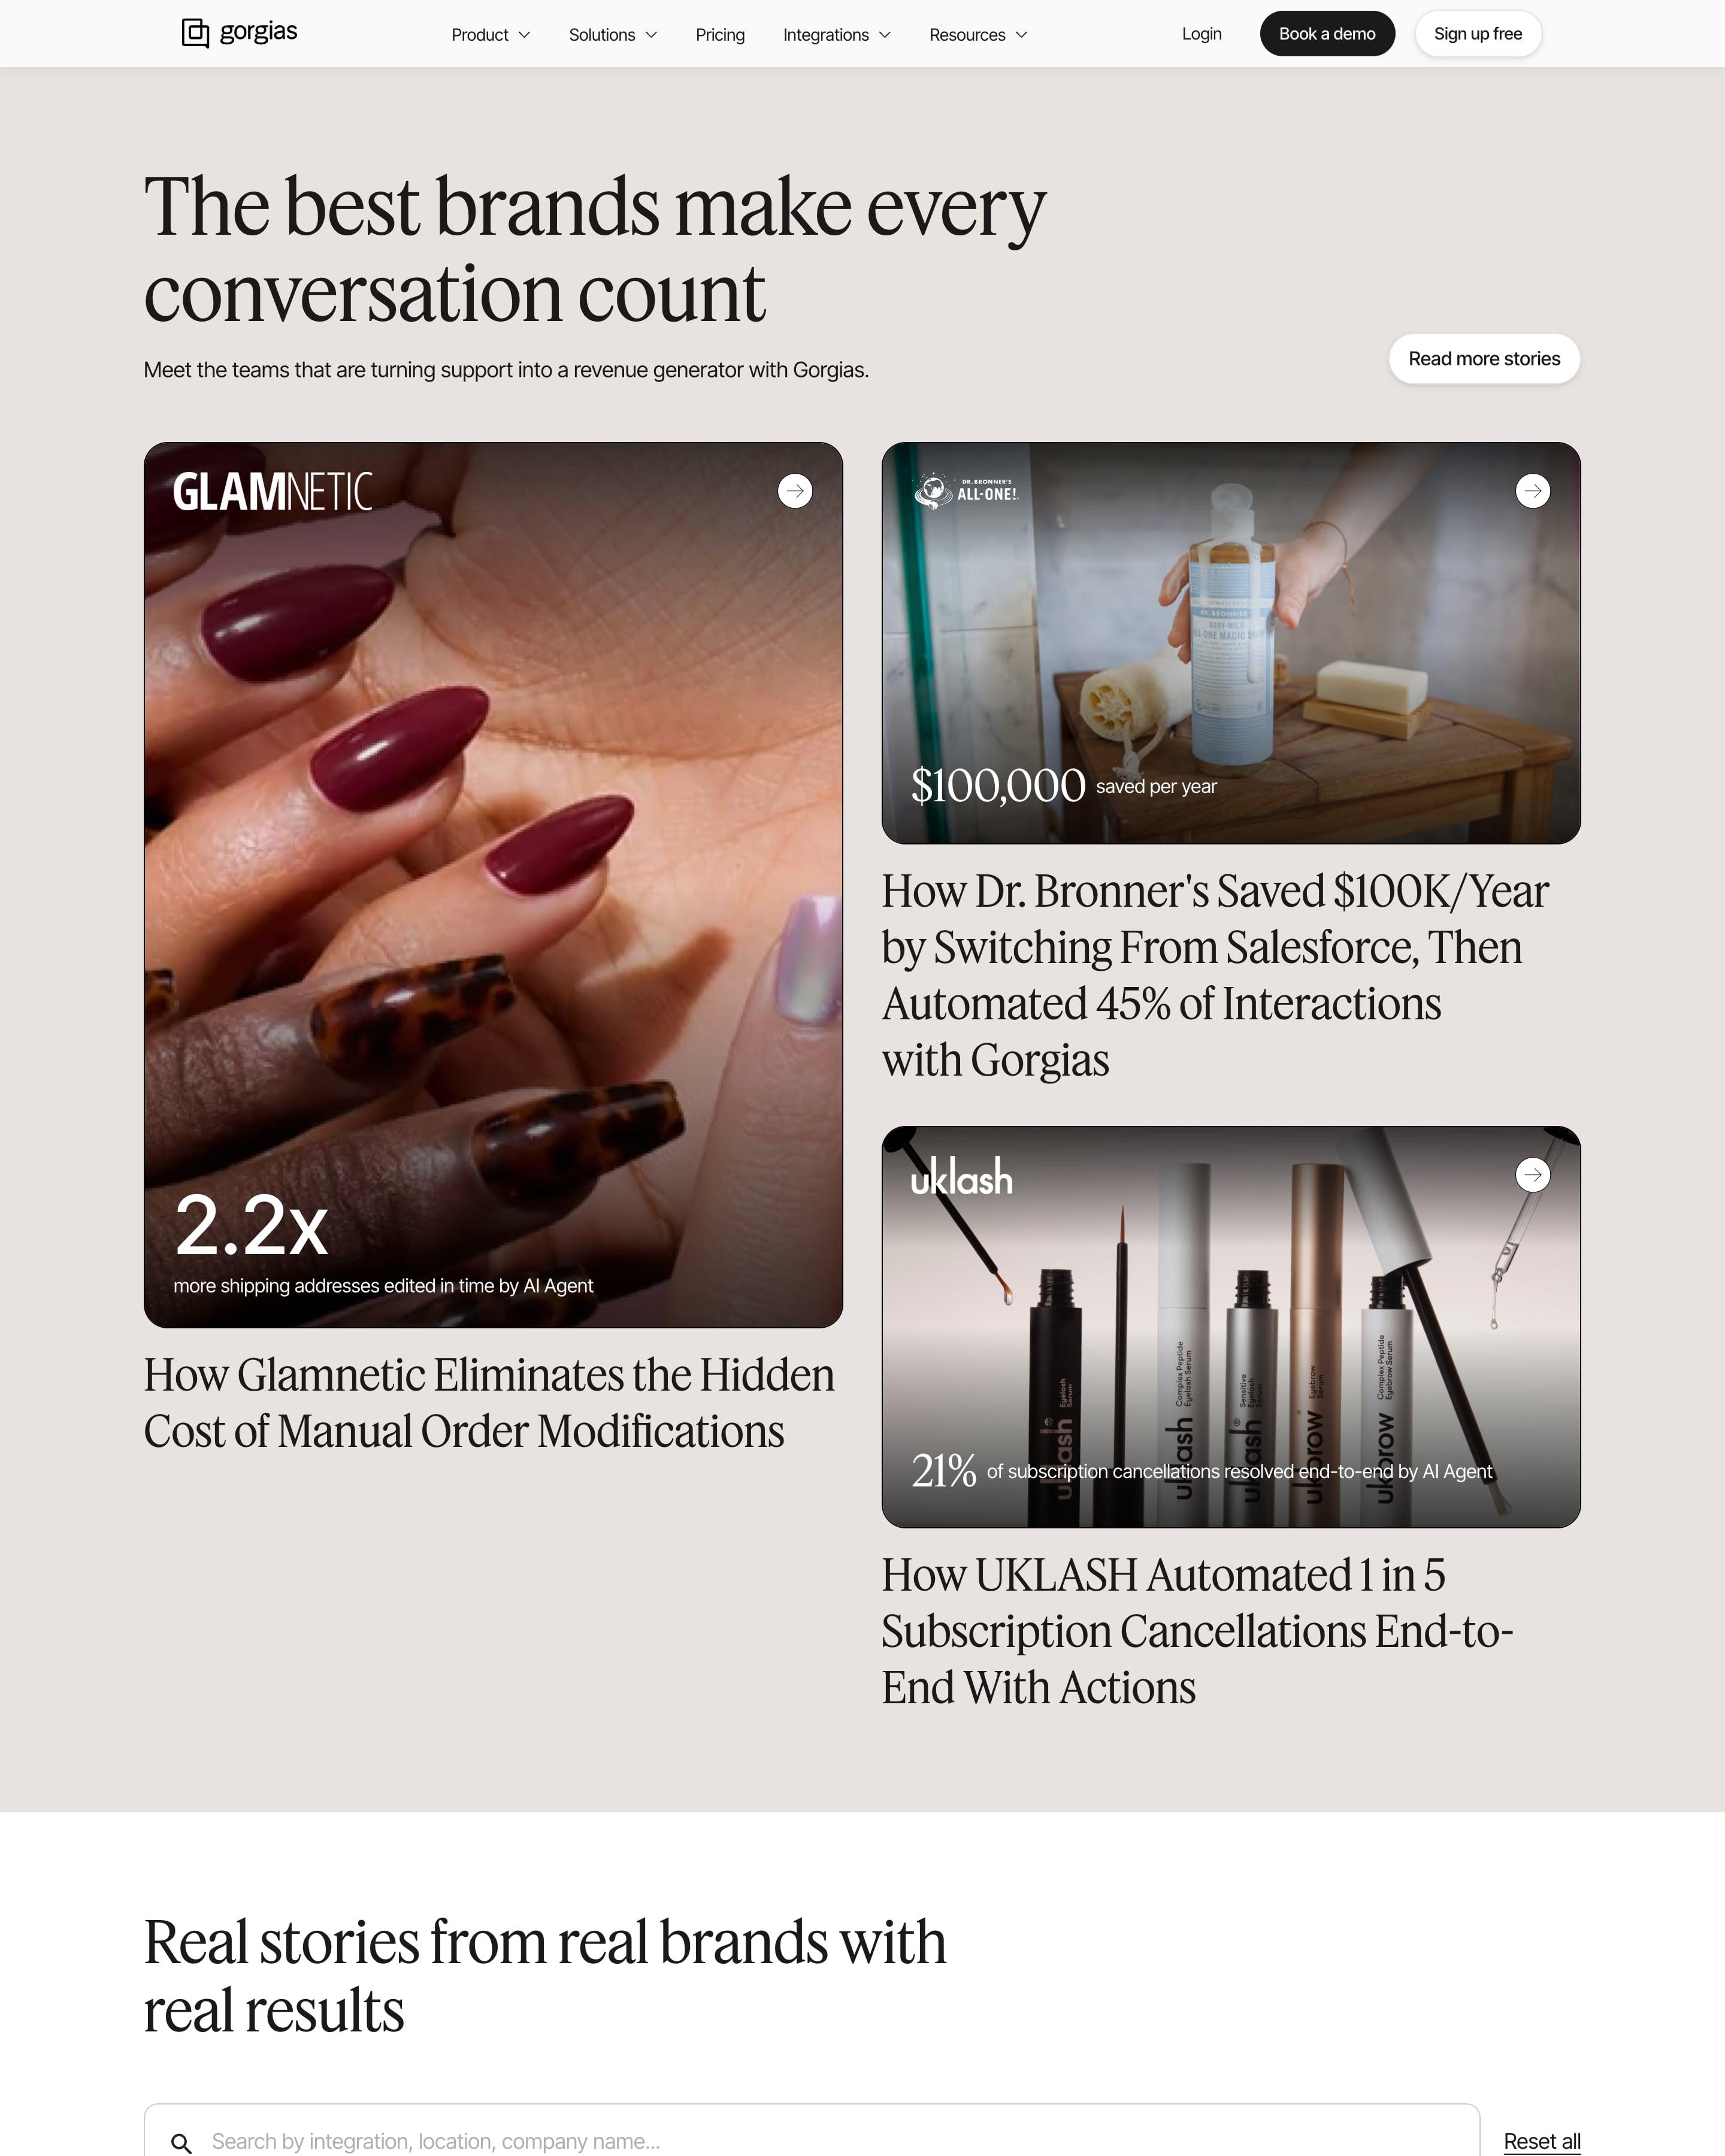
Numbers lead the story cards, laid over the photo (2.2x, $100,000 saved per year, 56%) above a large headline and product tags. The library can be searched and filtered by industry, company size, product and previous helpdesk. Filtering by the tool a customer switched from is a detail worth copying.
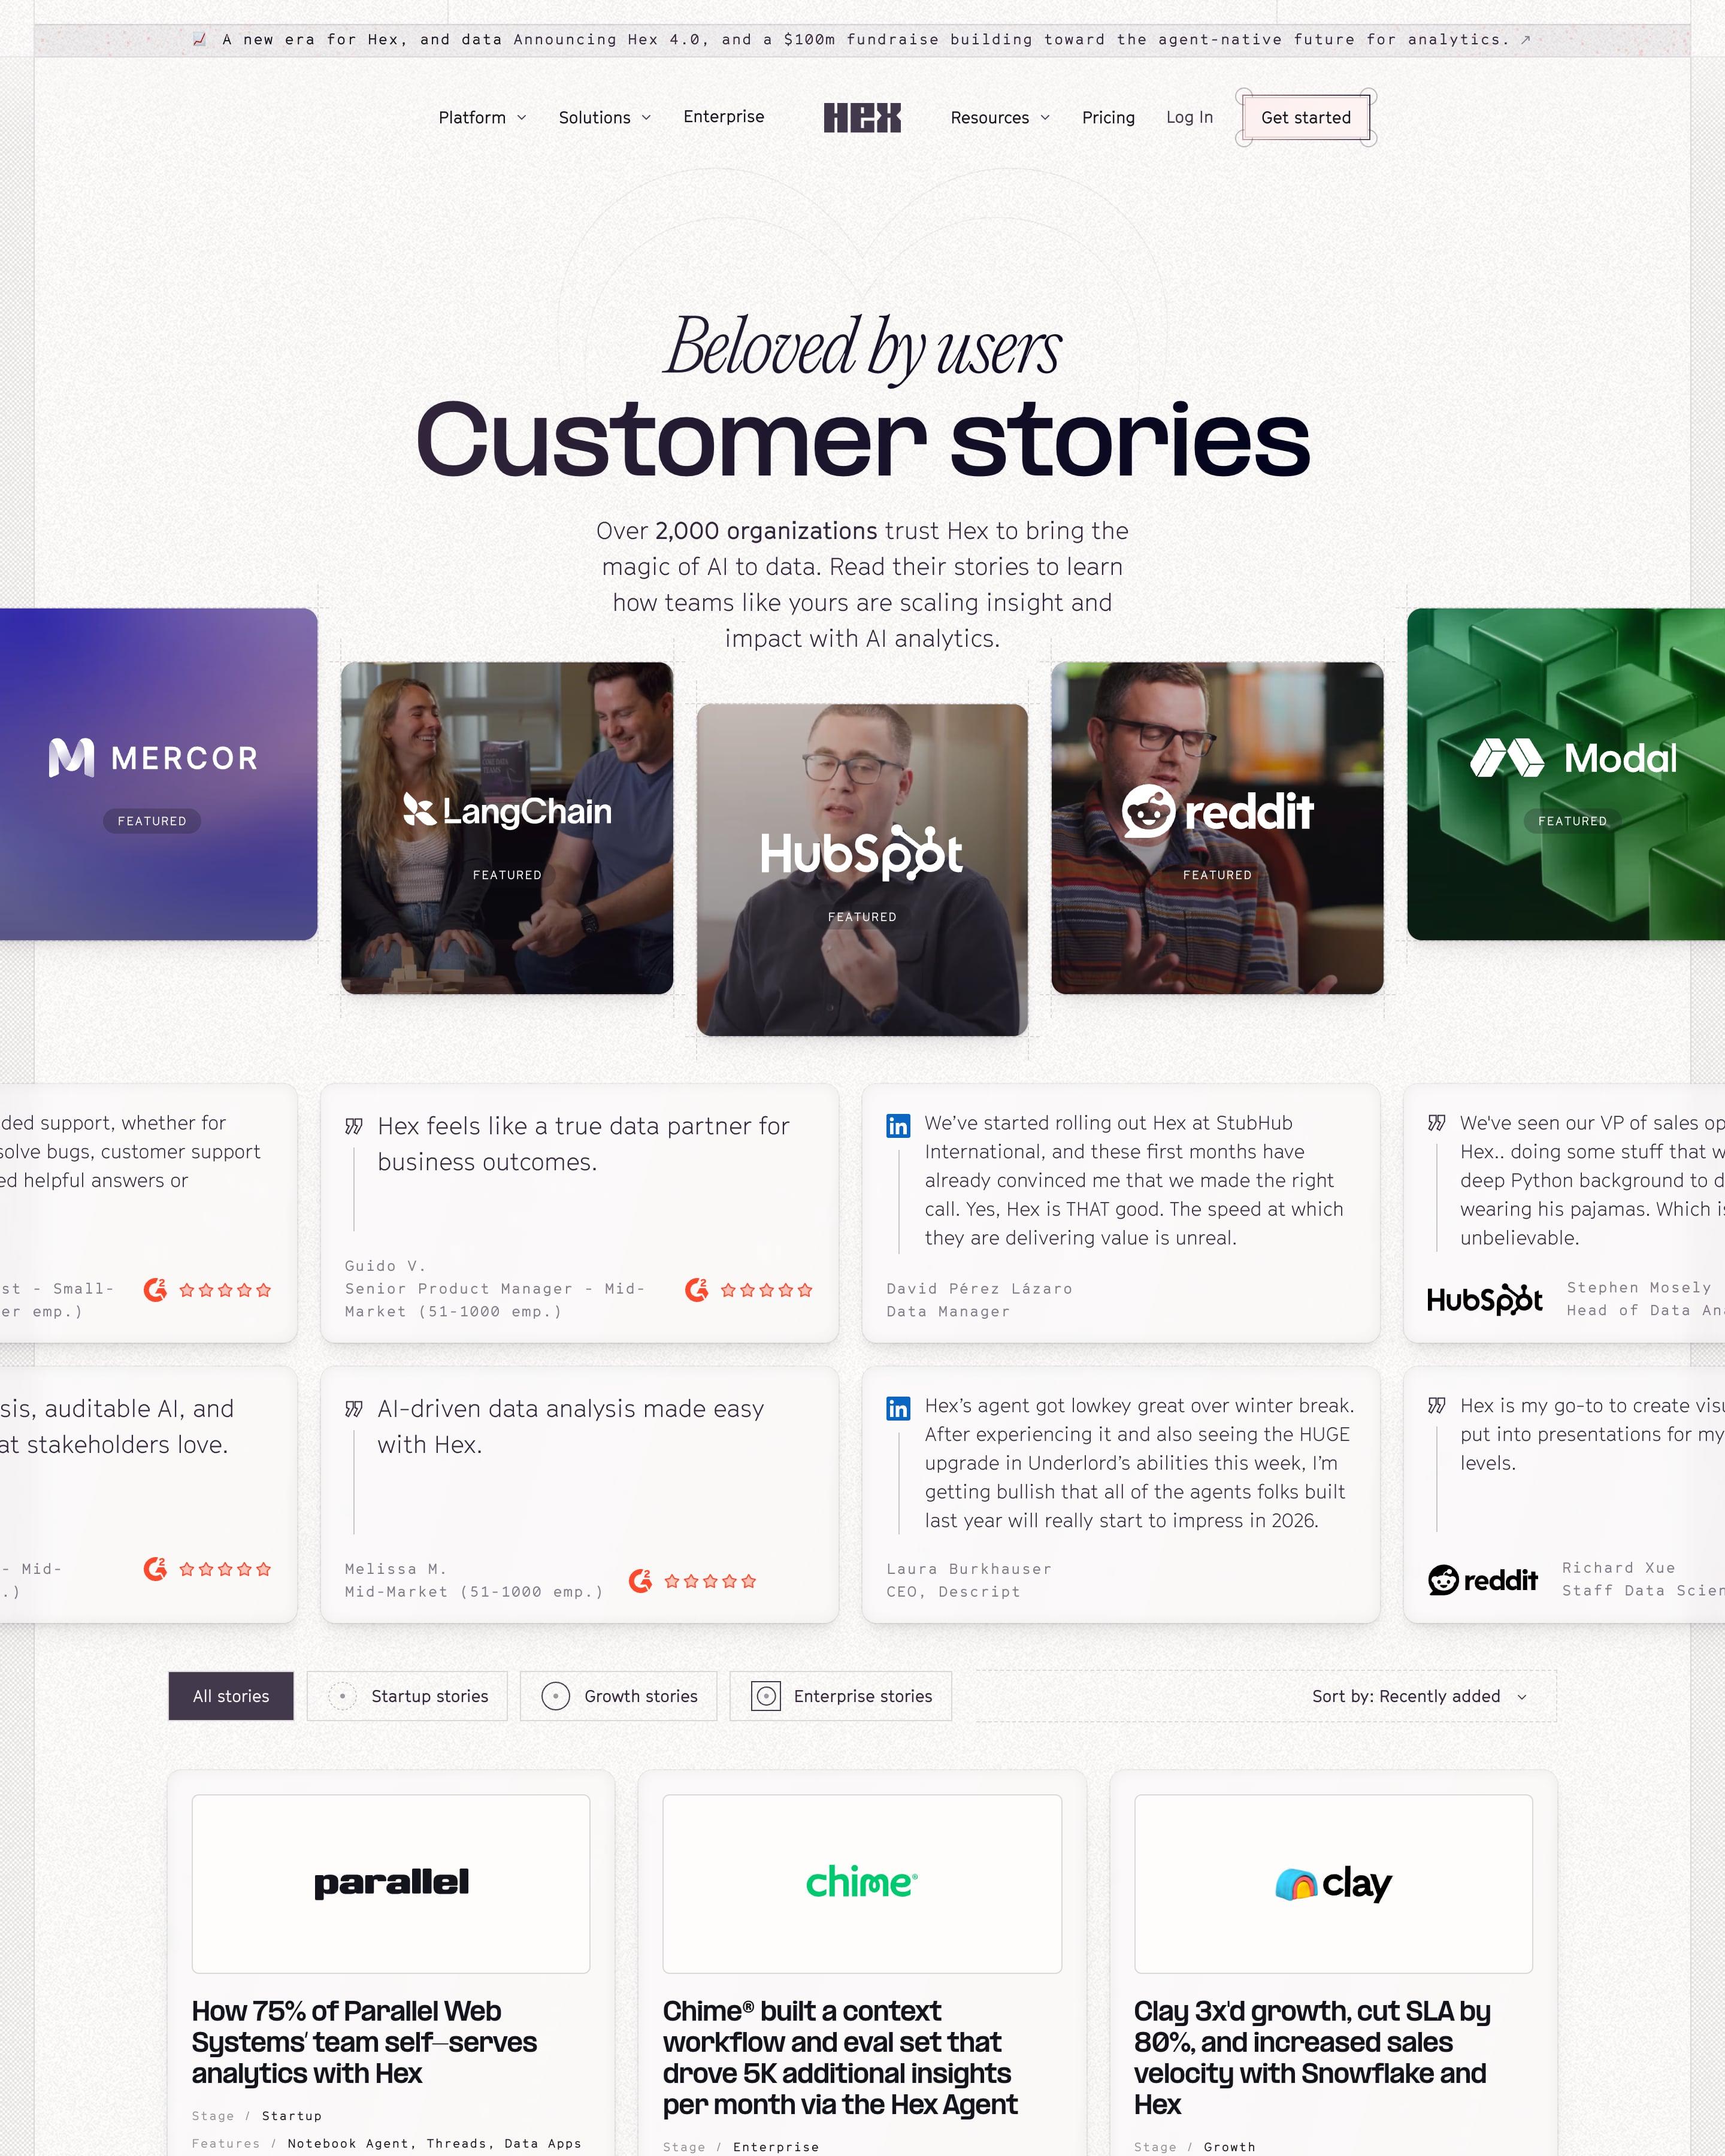
Under "Beloved by users" and a bold "Customer stories", a fanned row of featured cards mixes video stills and brand tiles for Mercor, LangChain and Modal. Review cards from G2 and LinkedIn follow, then a three-column grid where each story has a logo box, a results headline and monospaced metadata for stage, features, industry and company size. Those metadata lines suit any case-study index.
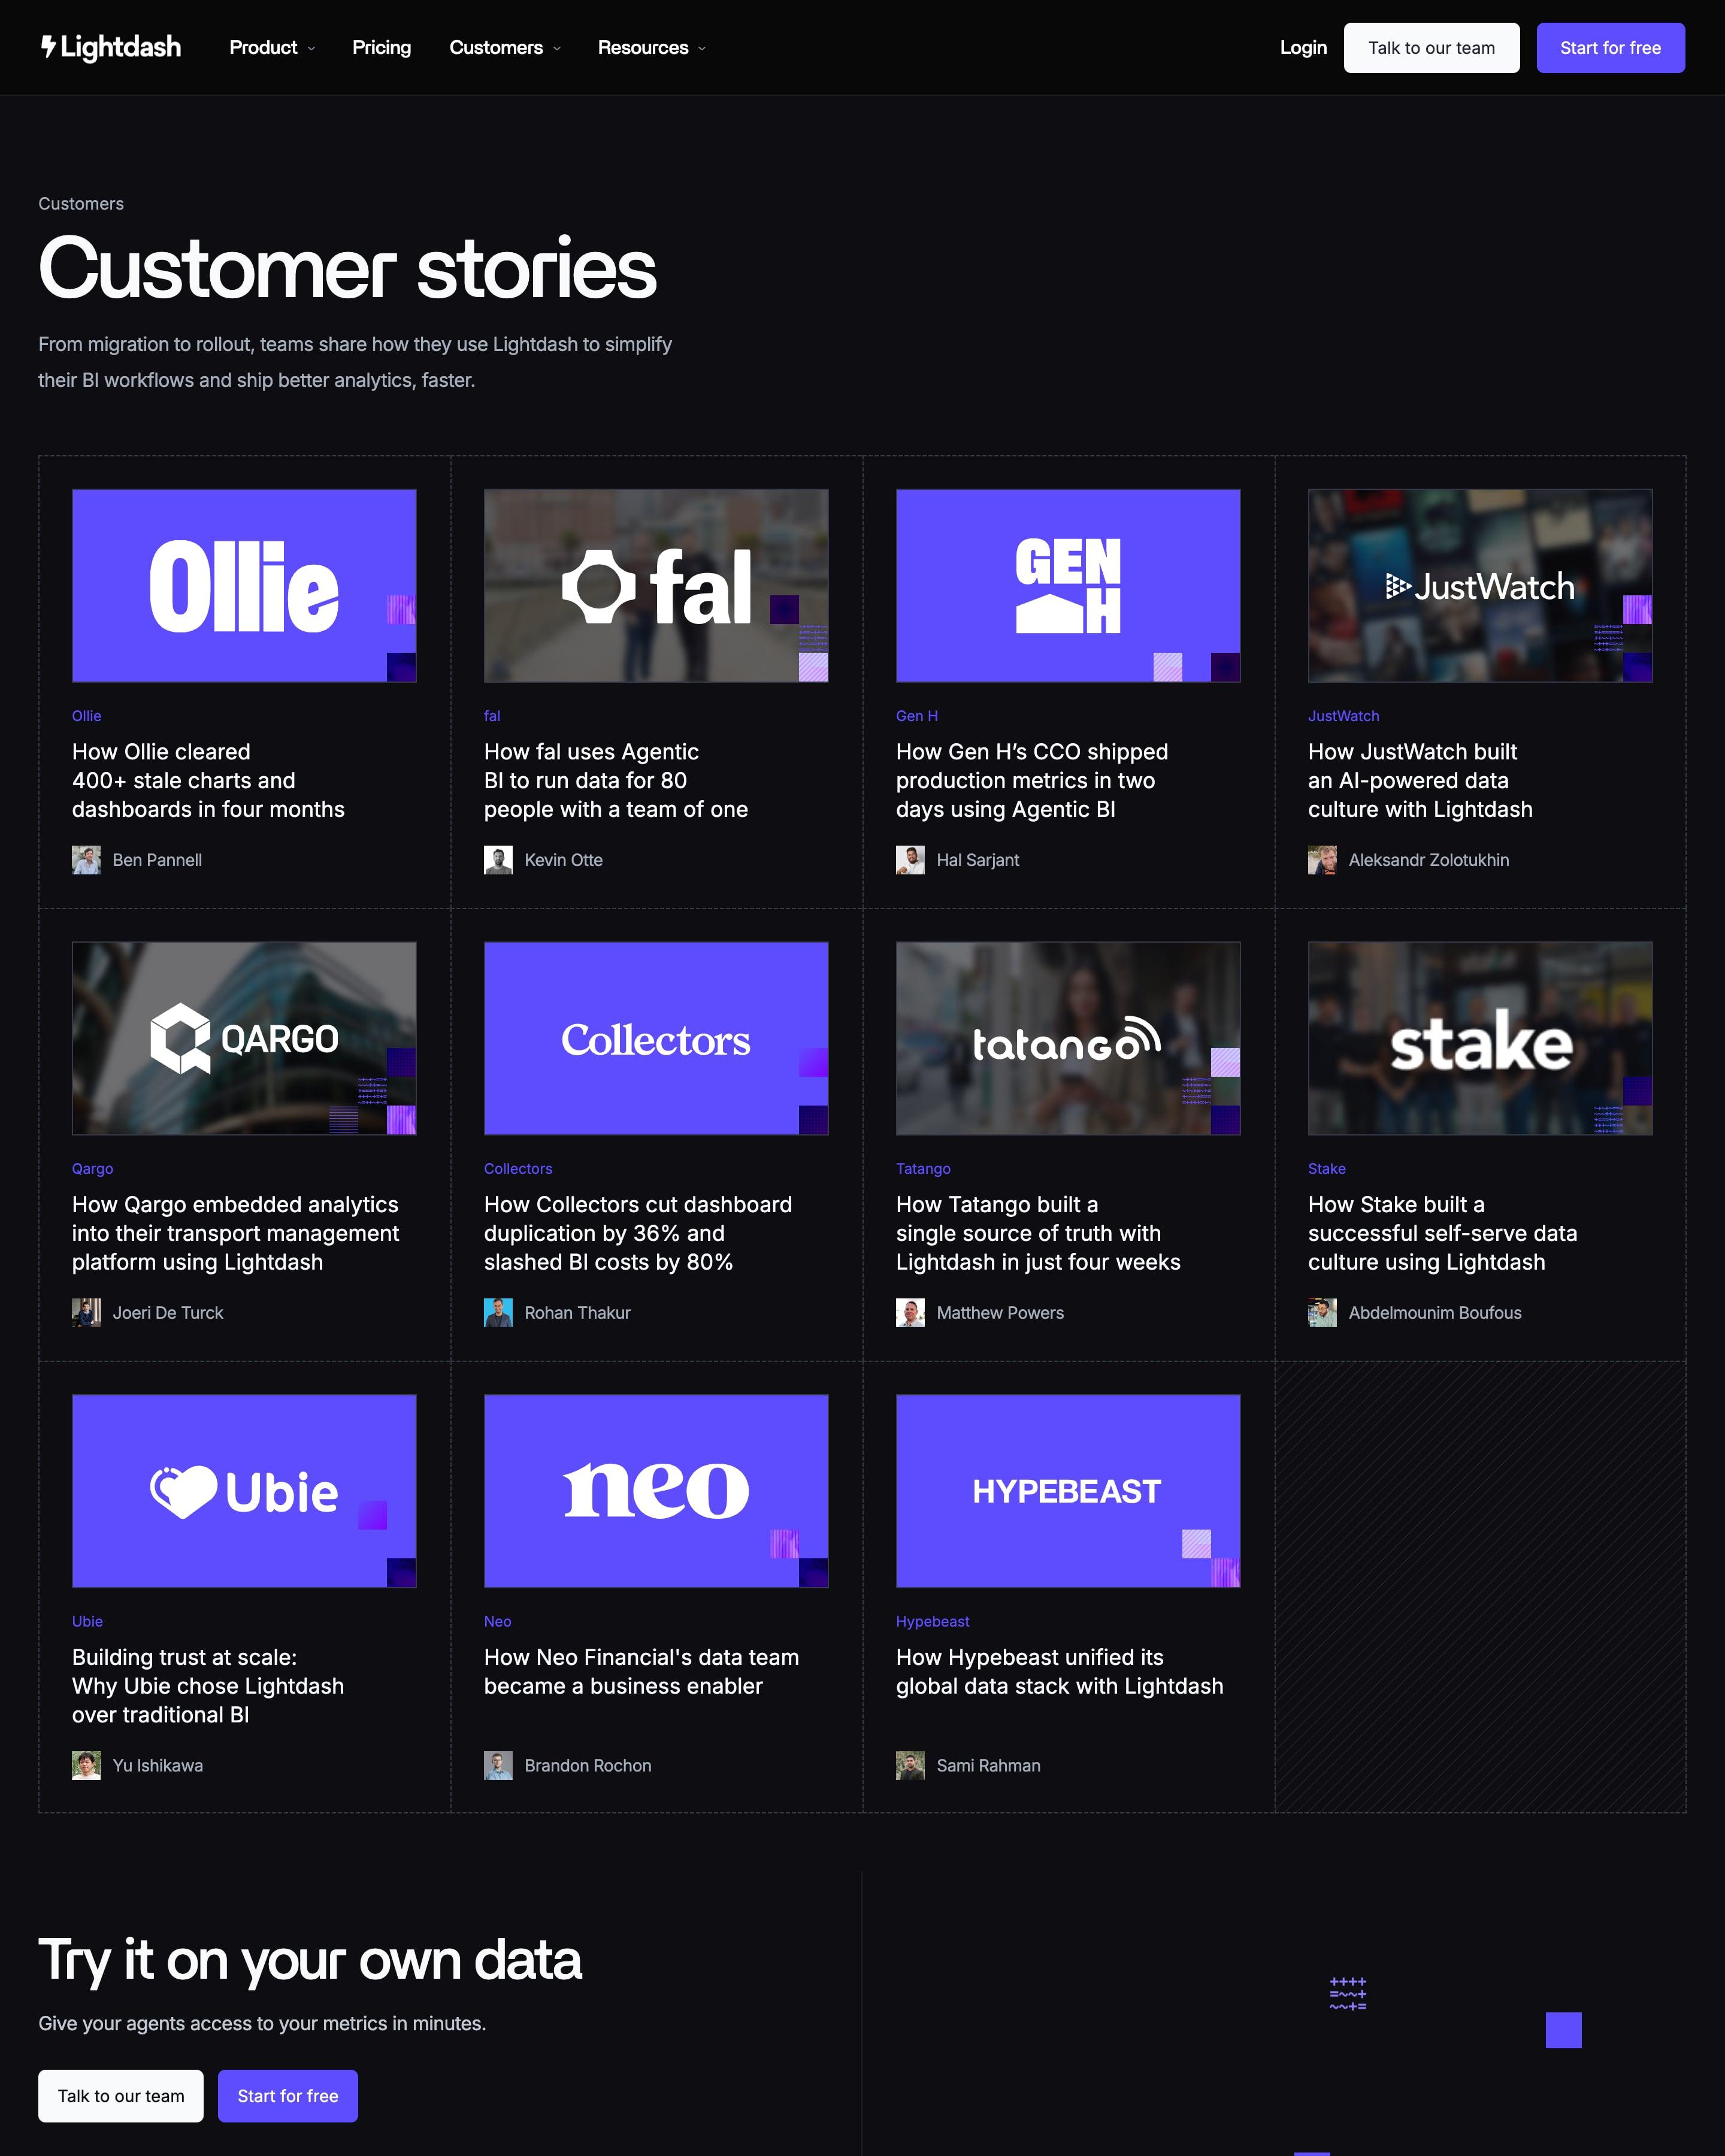
With no filters, eleven stories fill a four-column grid of dashed cells. Every cover follows one recipe worth reusing: the customer's logo in white on a violet panel or a darkened photo, with a few pixel squares in a corner. Each card ends with the featured person's headshot and name.
Industry tabs sit over story cards that put each logo on a black-and-white photo or a flat brand-colour tile, above a short headline. A row of three big numbers breaks up the grid. Further down, more companies sit in plain table rows with industry tags, a format worth copying.
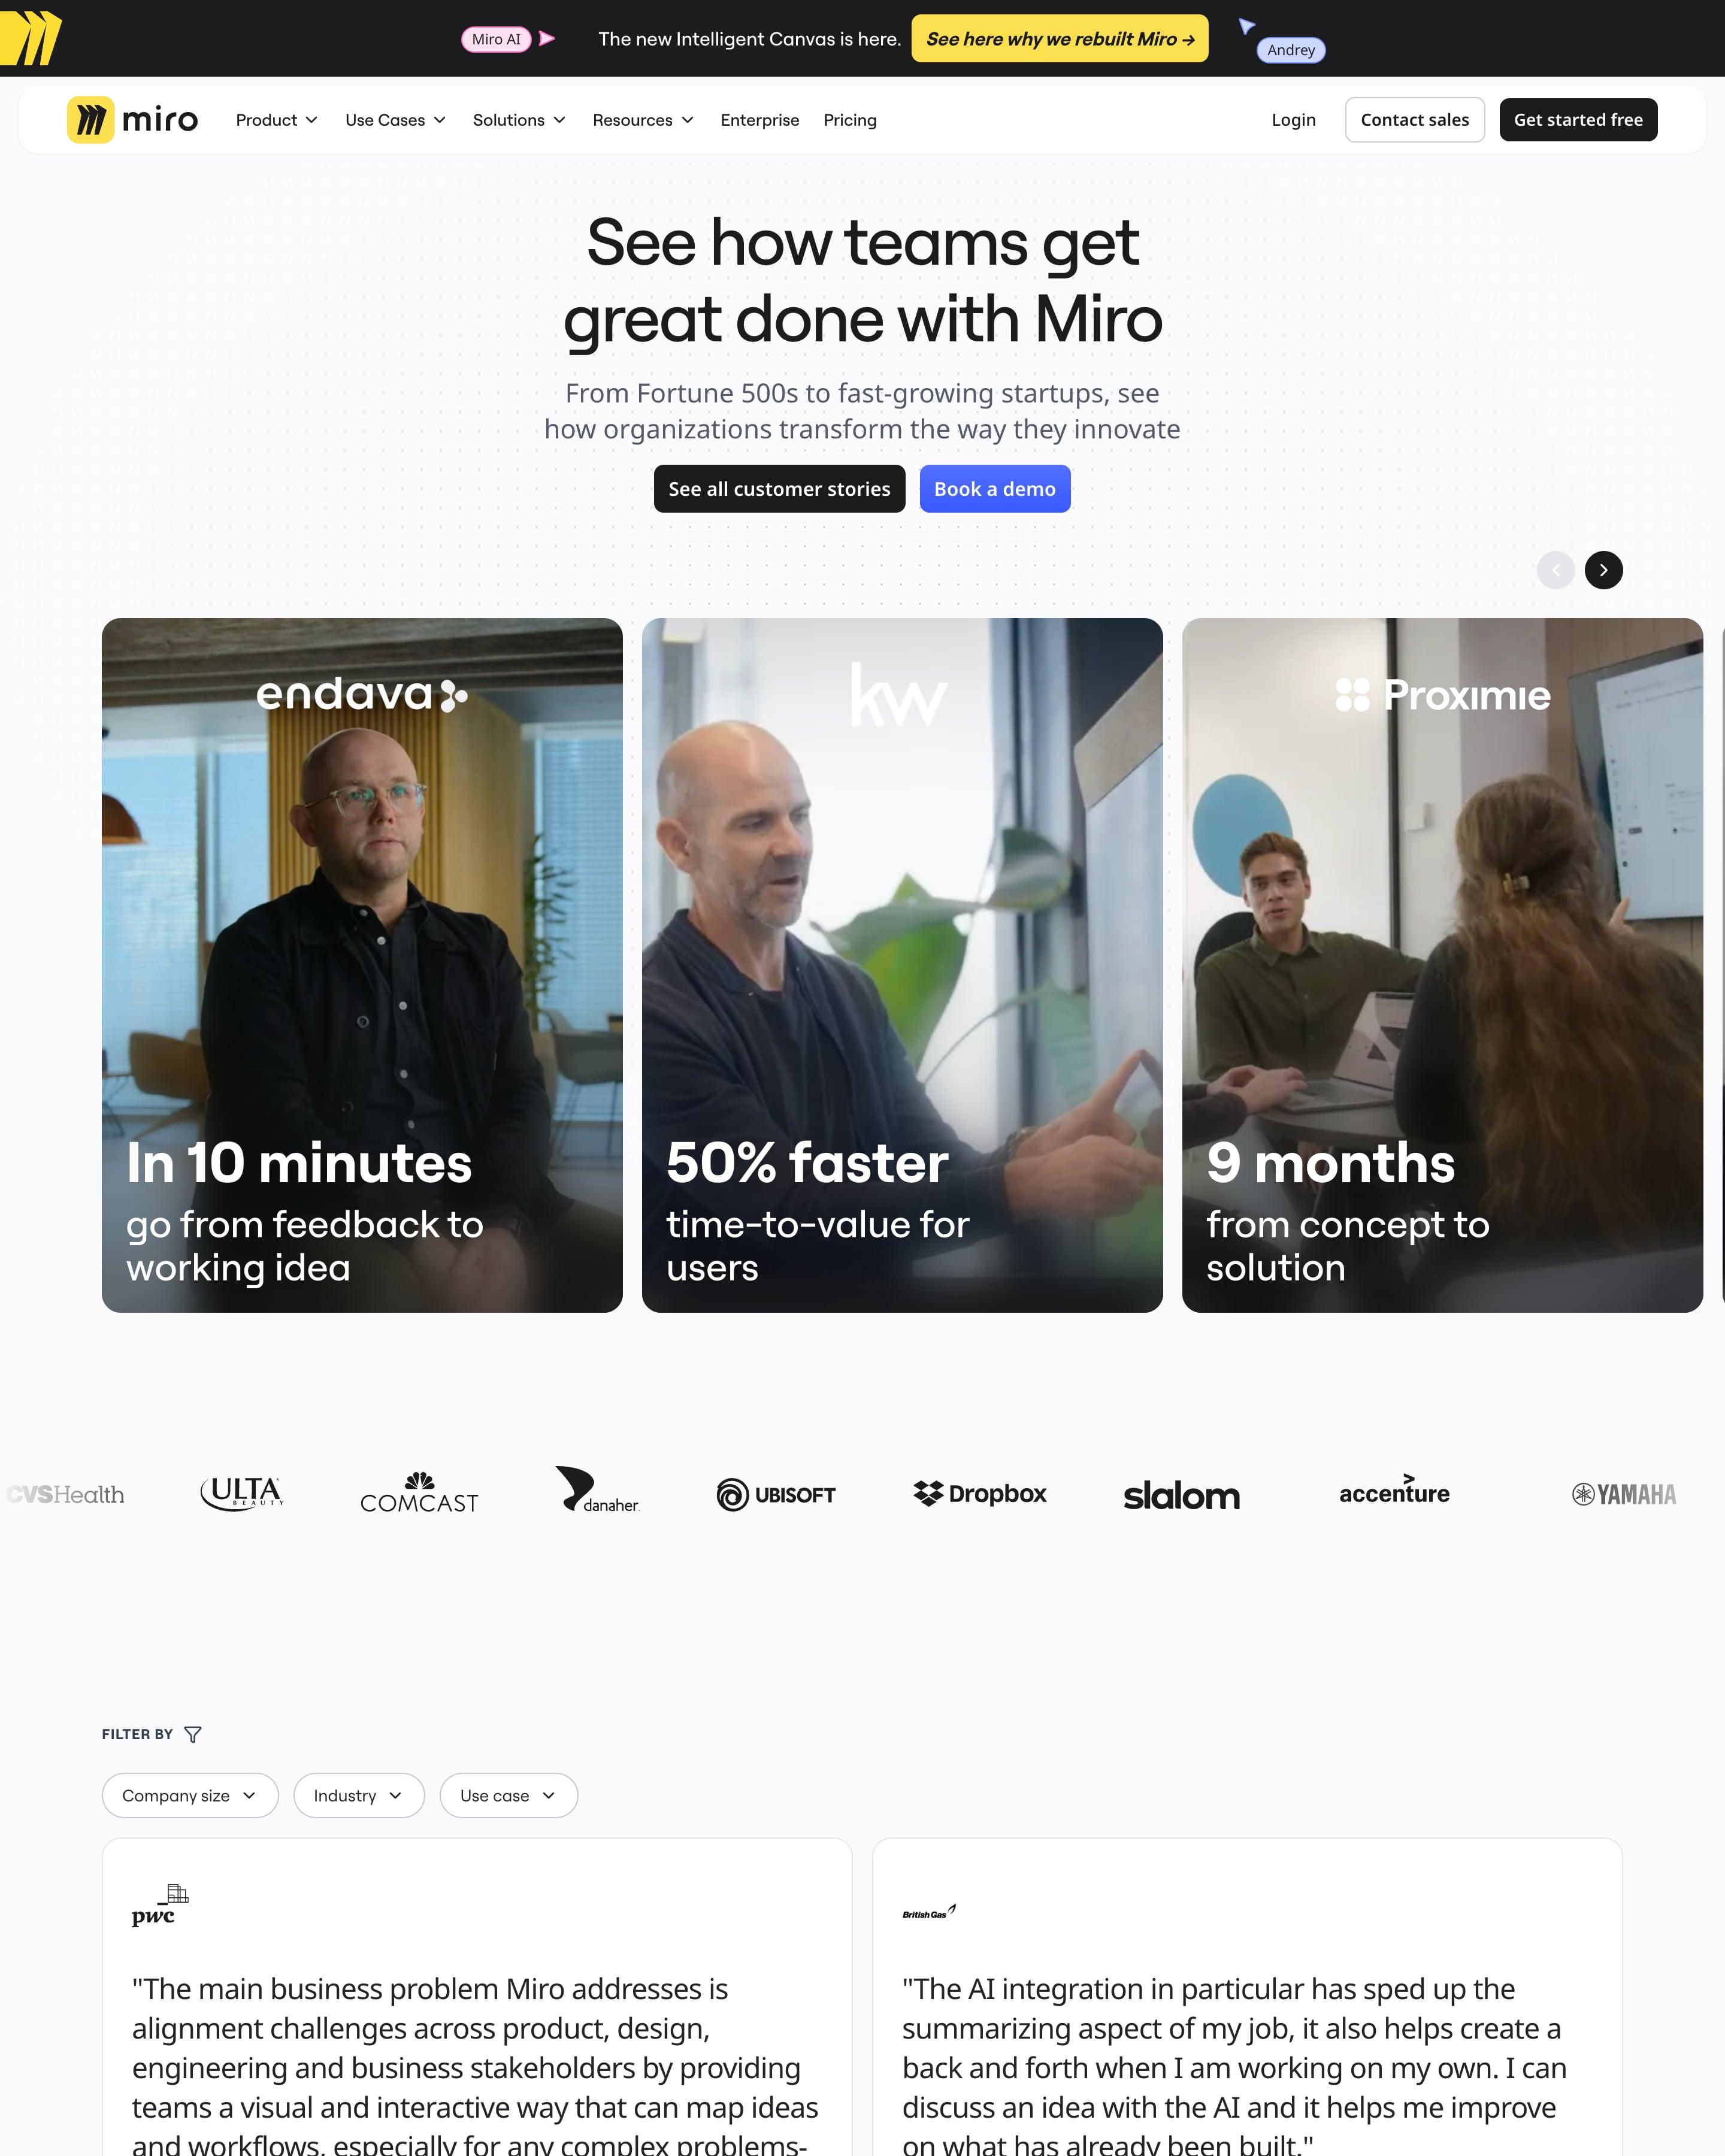
Large photo cards in a carousel each carry one outcome in big type, such as "50% faster time-to-value for users". Under a logo strip, filters for company size, industry and use case sit over a two-column wall of long quotes, each with a logo. That stat-on-photo carousel is the piece to borrow.
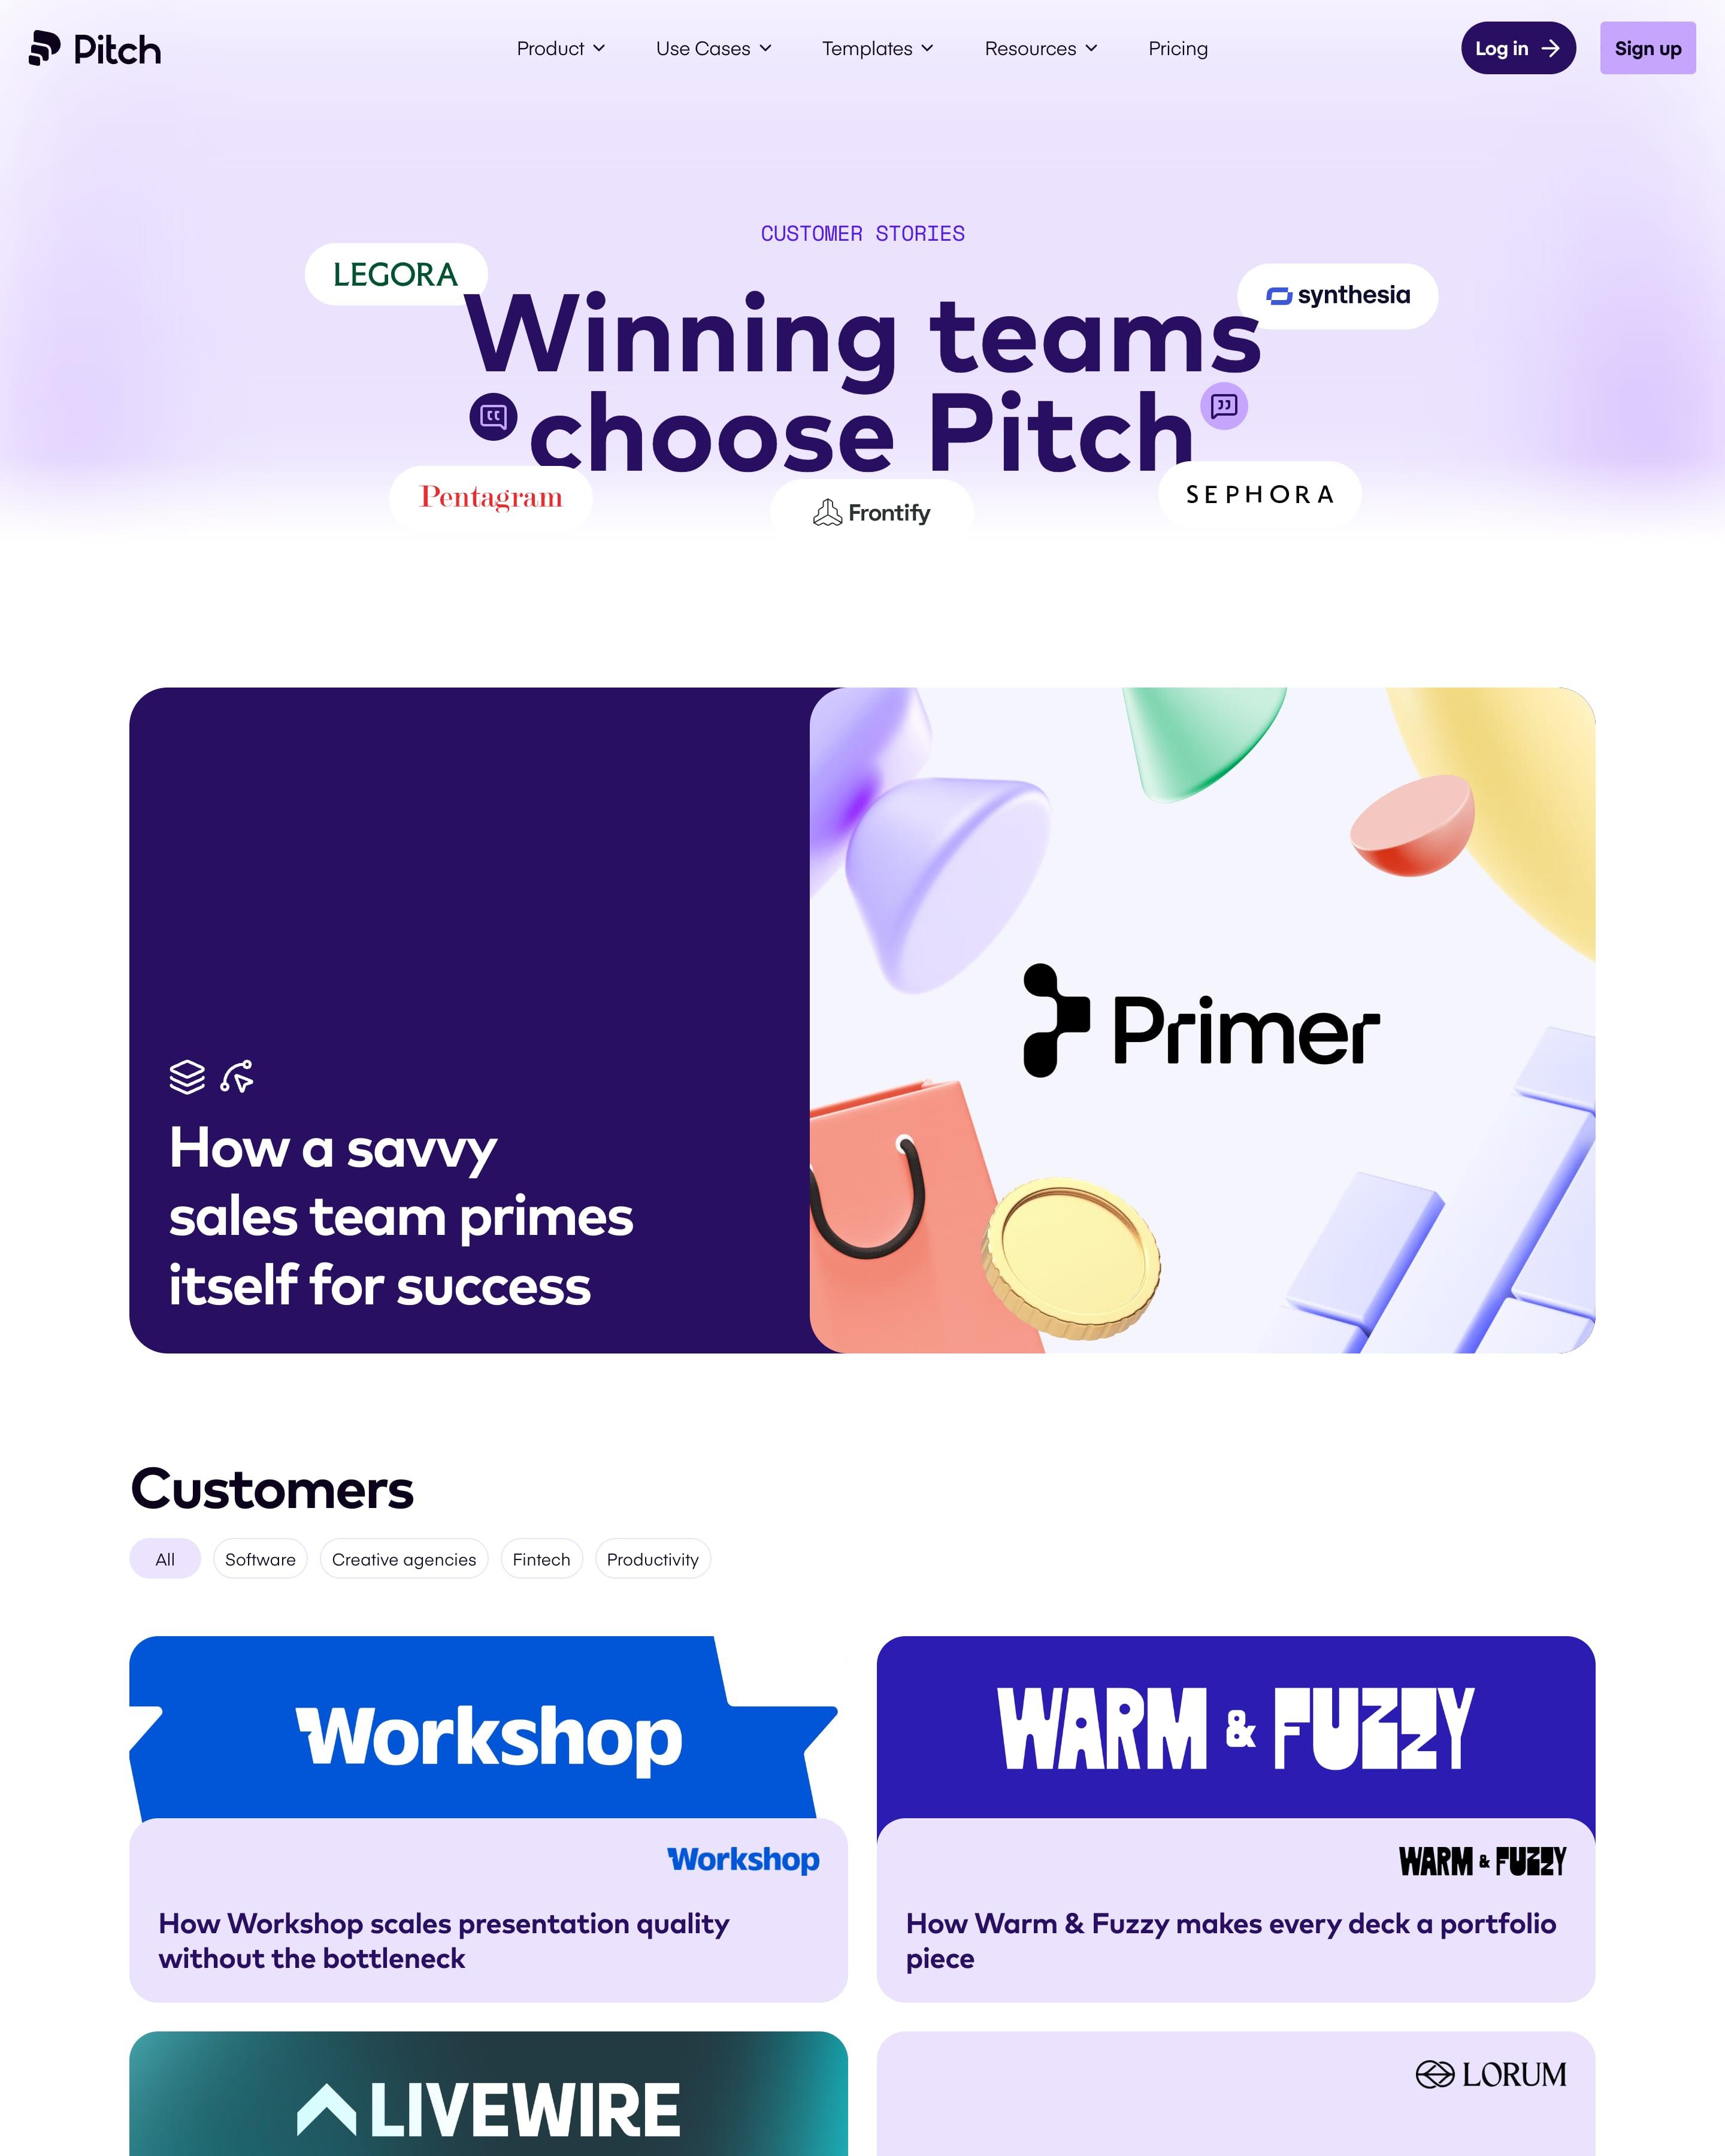
Customer logos float as white pills around the headline, and a featured story sets 3D shapes beside a dark purple panel. Category tabs head a two-column grid where some cards swap the cover for a short quote. Covers drawn in each customer's own brand colours and type are the idea to steal.
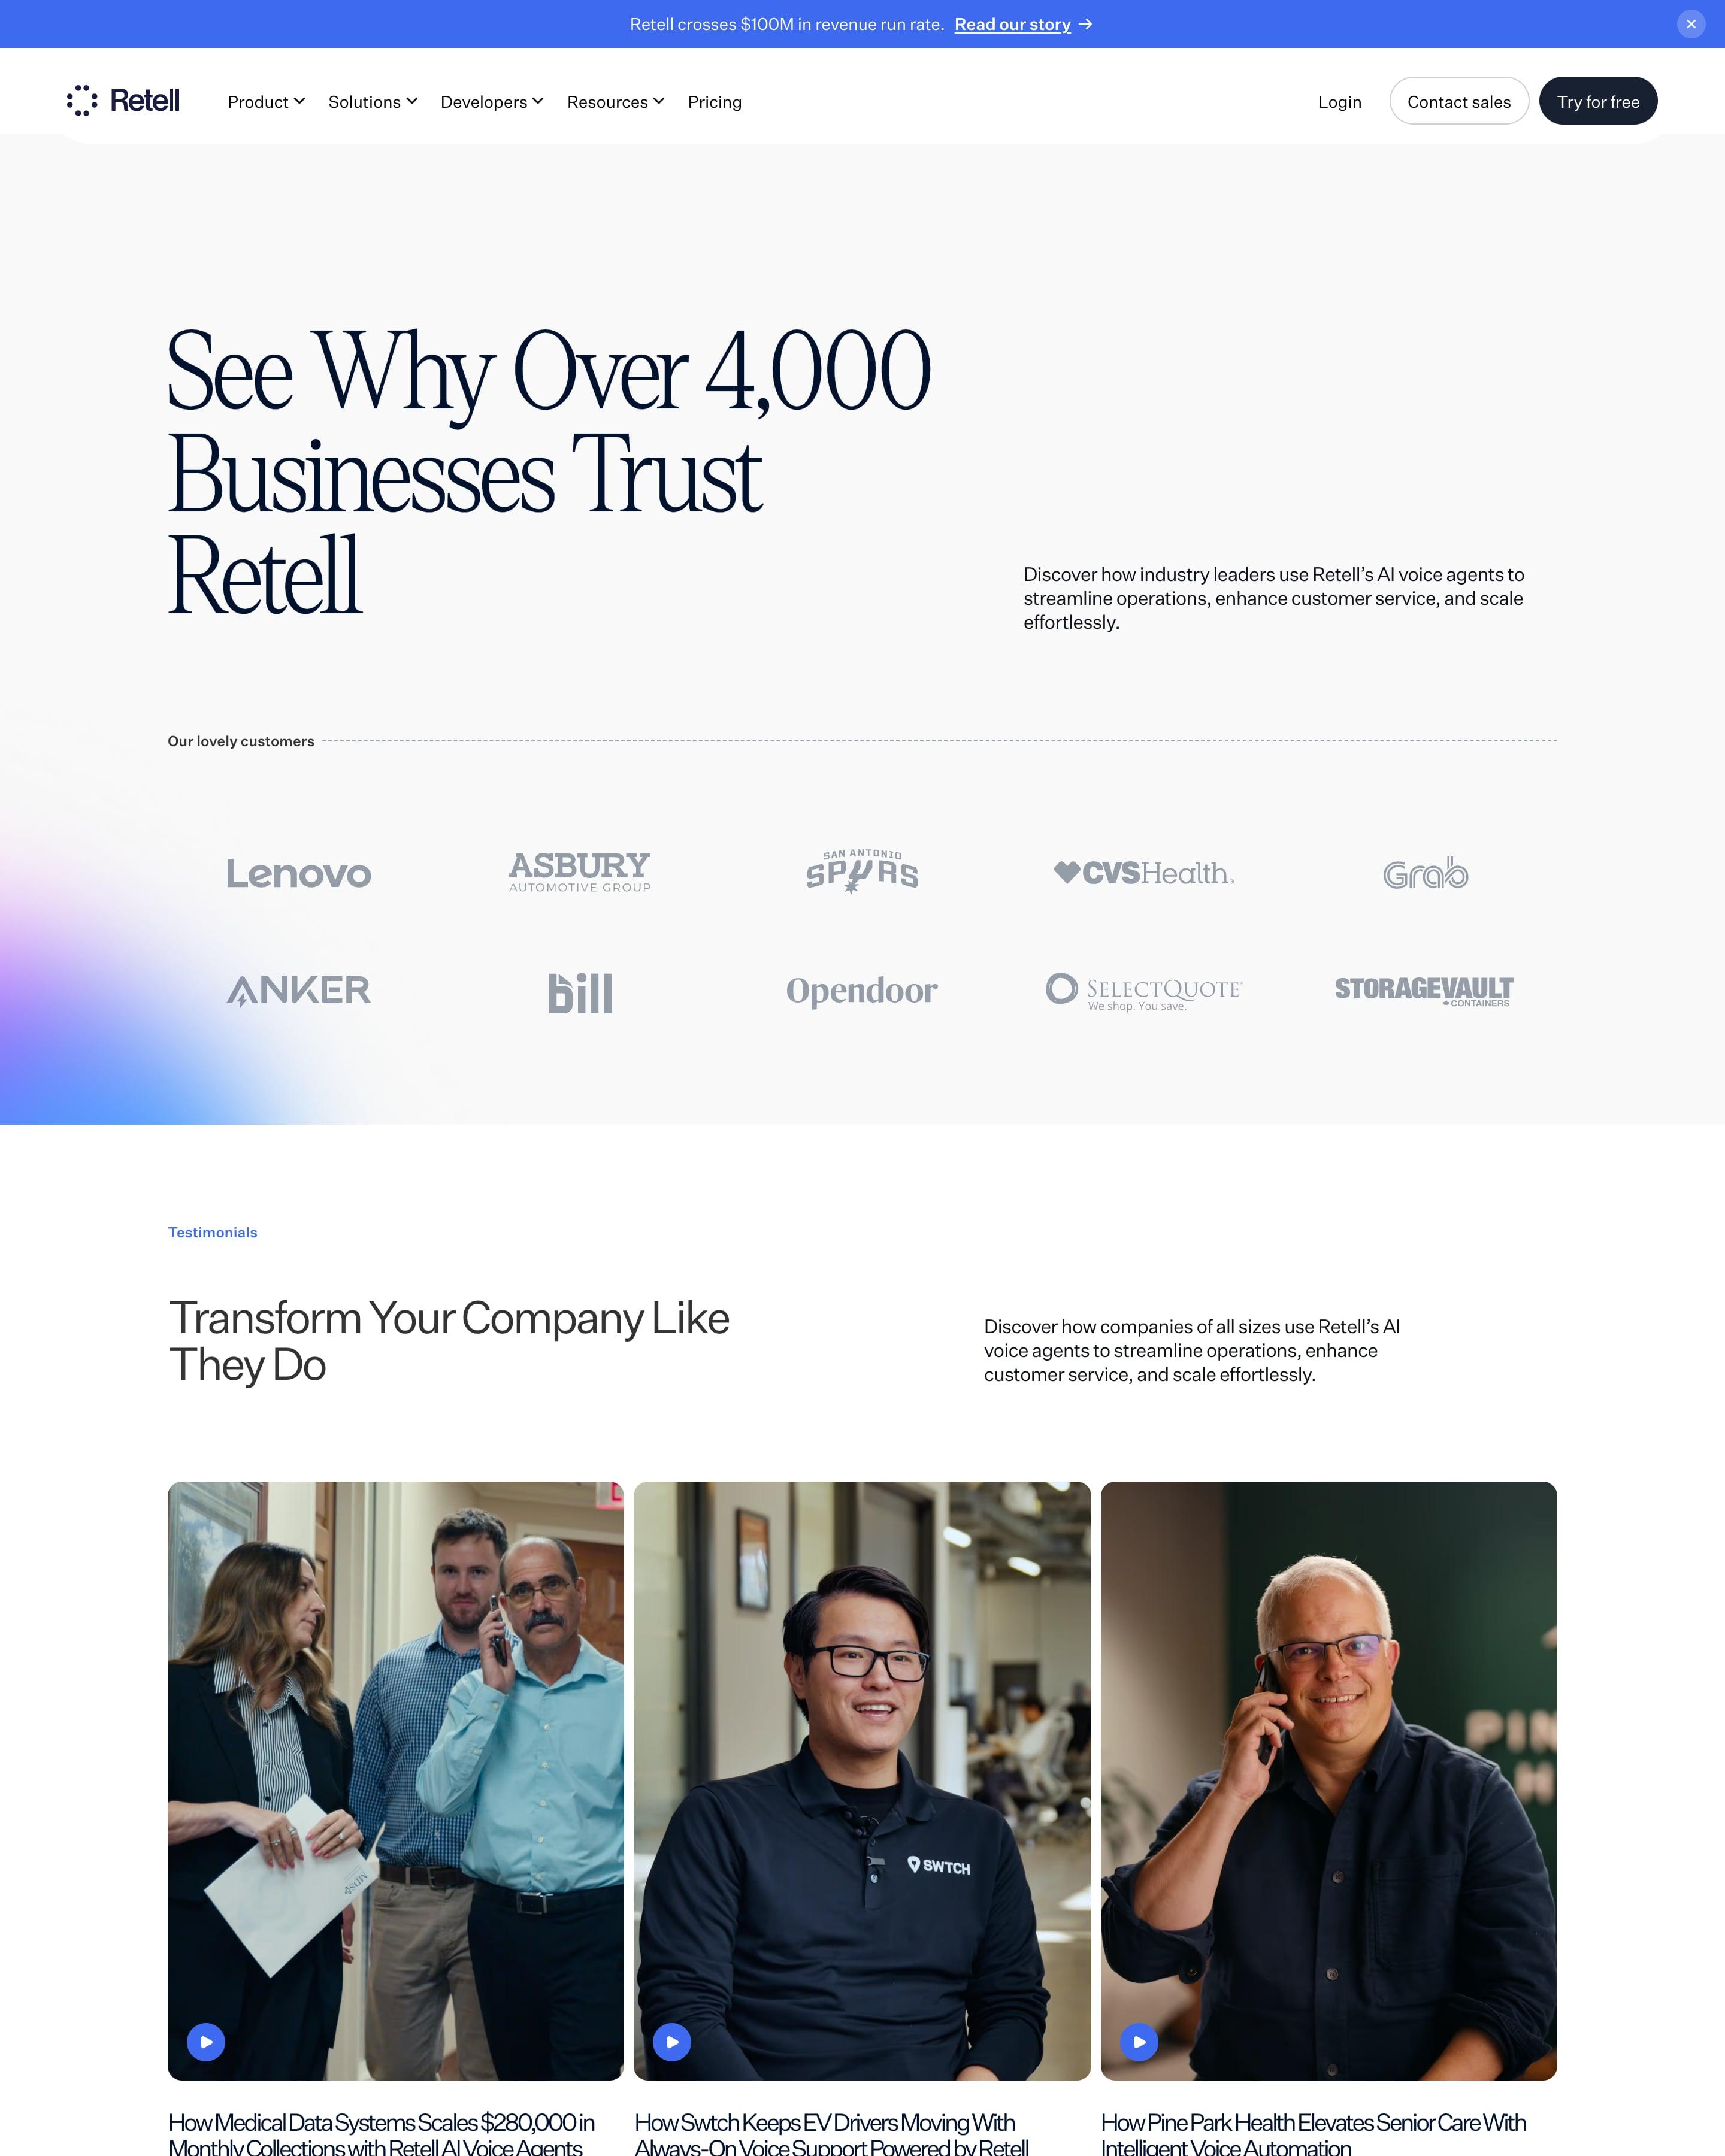
"See Why Over 4,000 Businesses Trust Retell" sits over a two-row logo wall with a violet glow in one corner. Three video testimonials follow, each a tall portrait with a play button, then an industry filter and a grid of case study cards: a photo with the customer's logo laid over it, an industry label and a headline with a number, like "$280,000 in Monthly Collections".
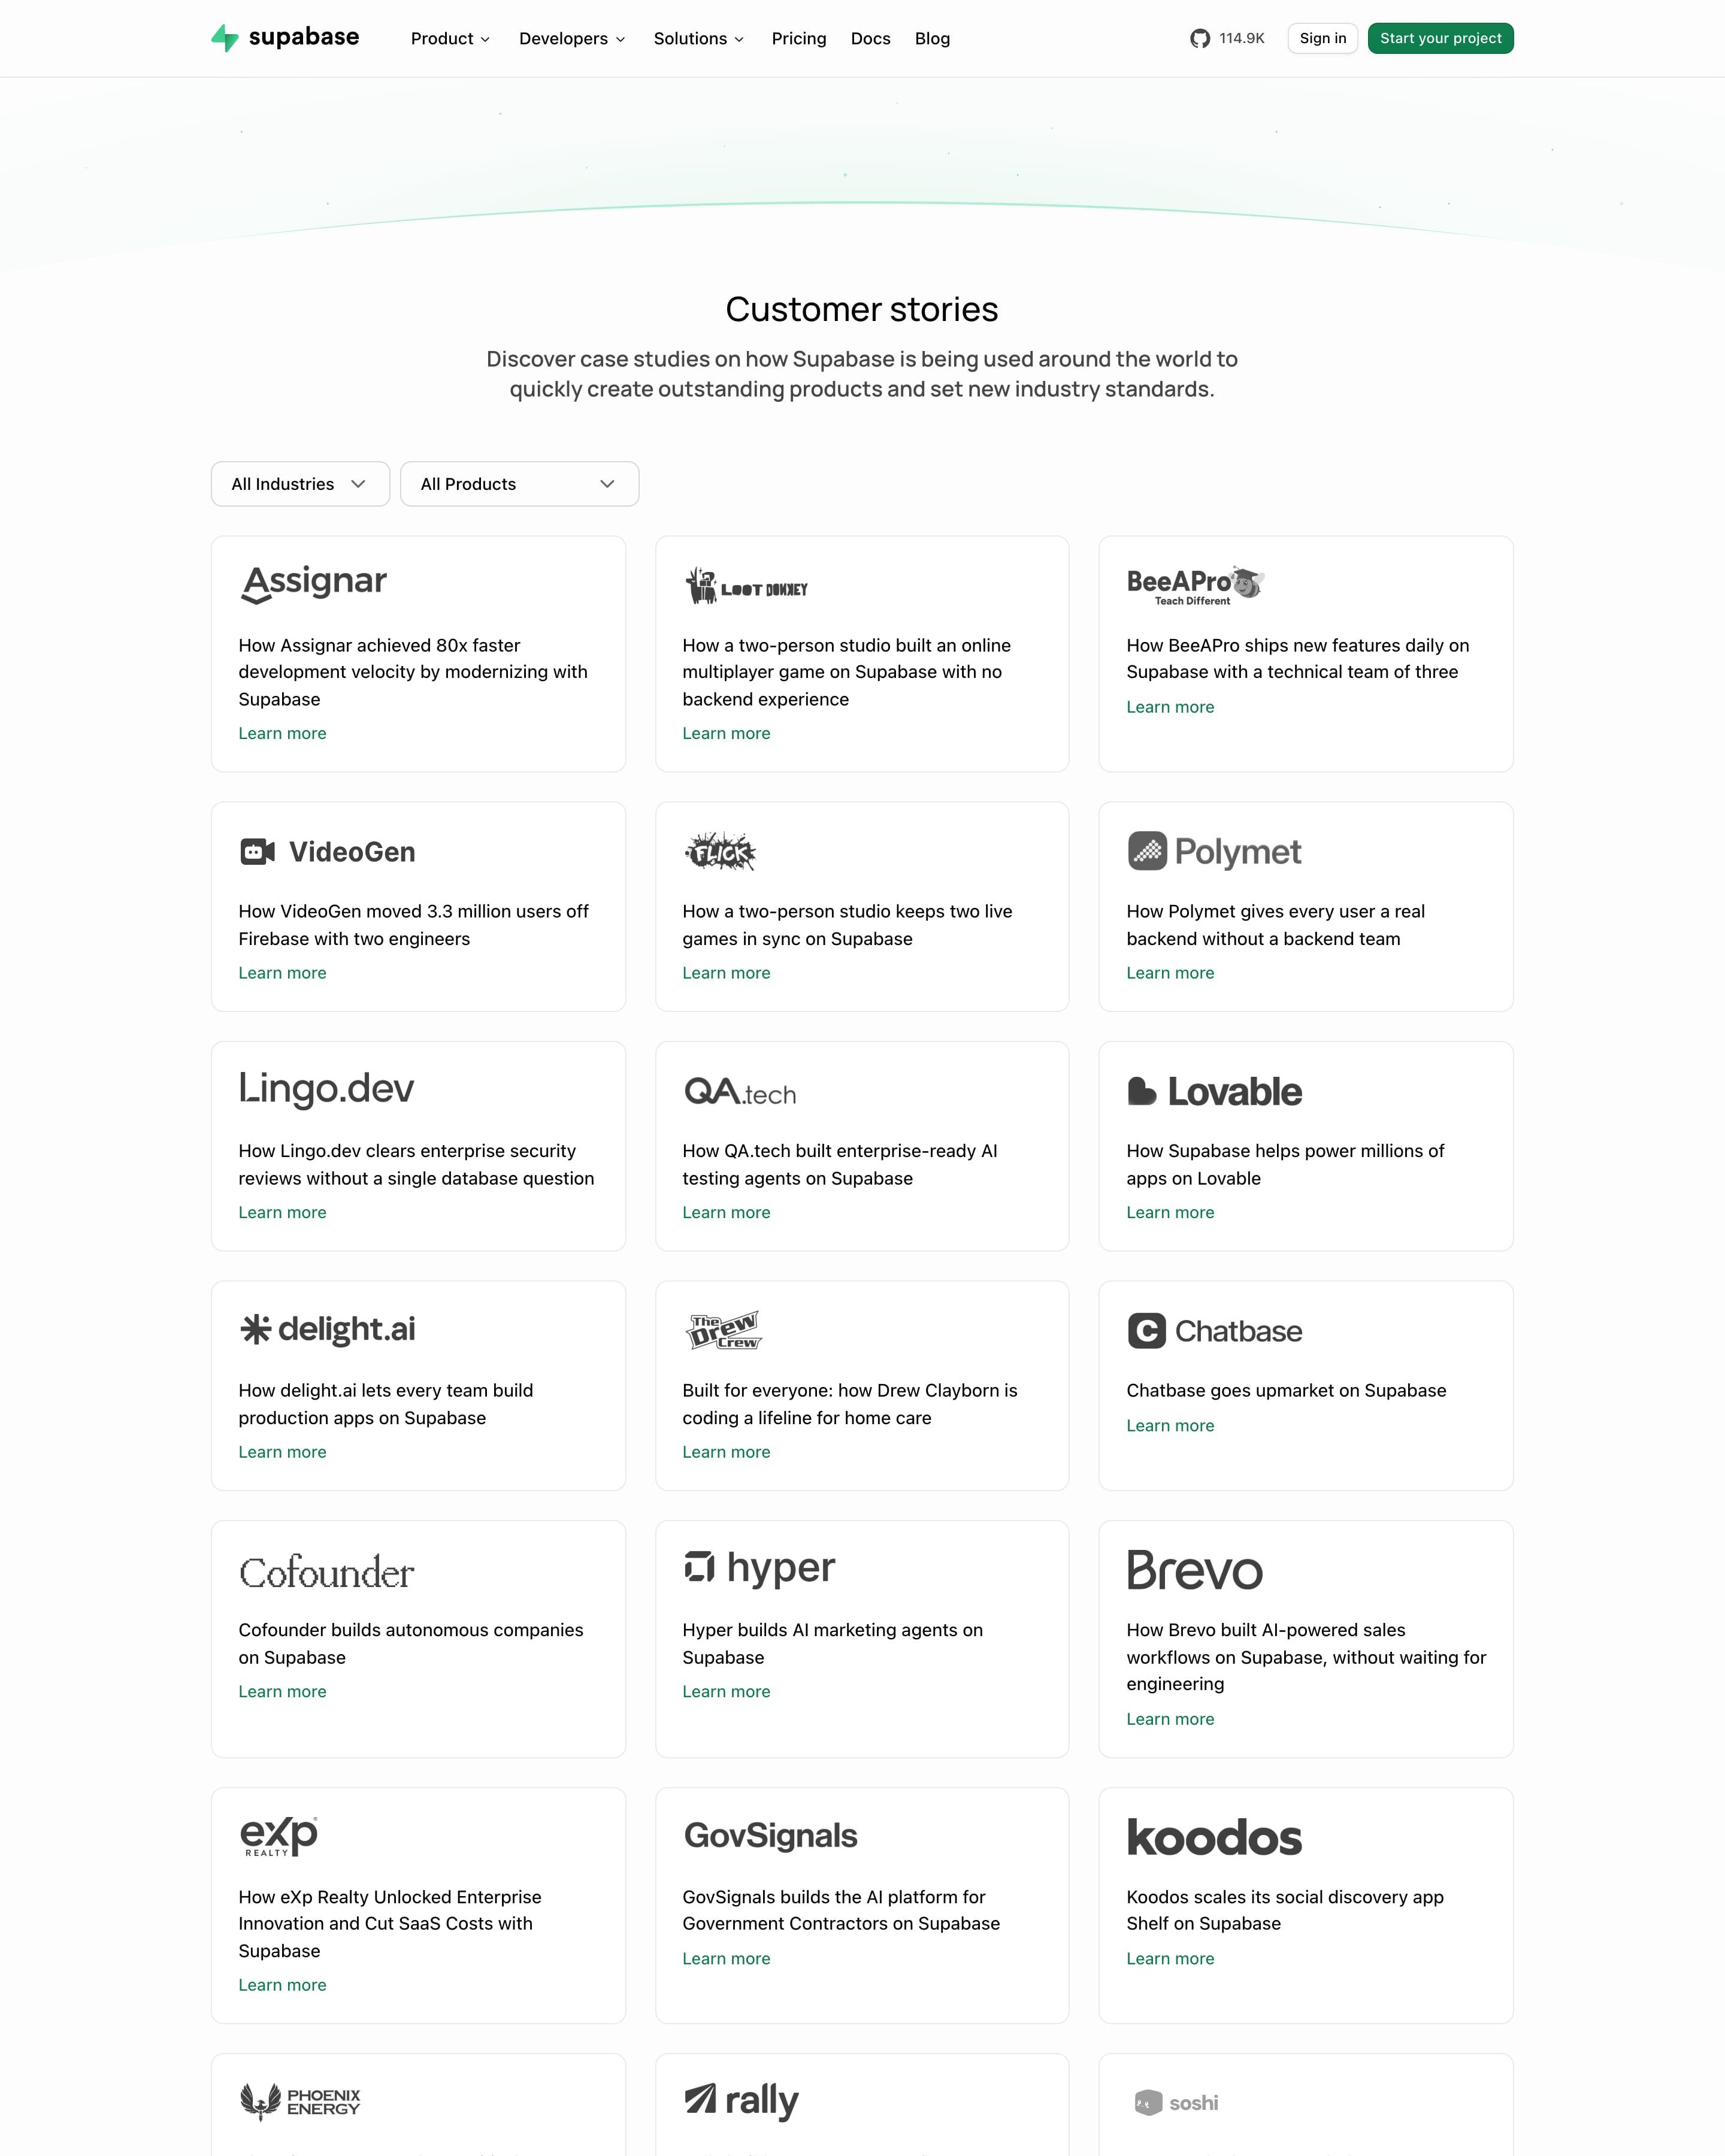
A soft green arc tops the "Customer stories" header, and two dropdowns filter by industry and product. The rest is a three-column grid of about 50 identical white cards: customer logo, a one-line result like "80x faster development velocity", and a green "Learn more" link. Leading with the logo and the number keeps a very long list scannable.
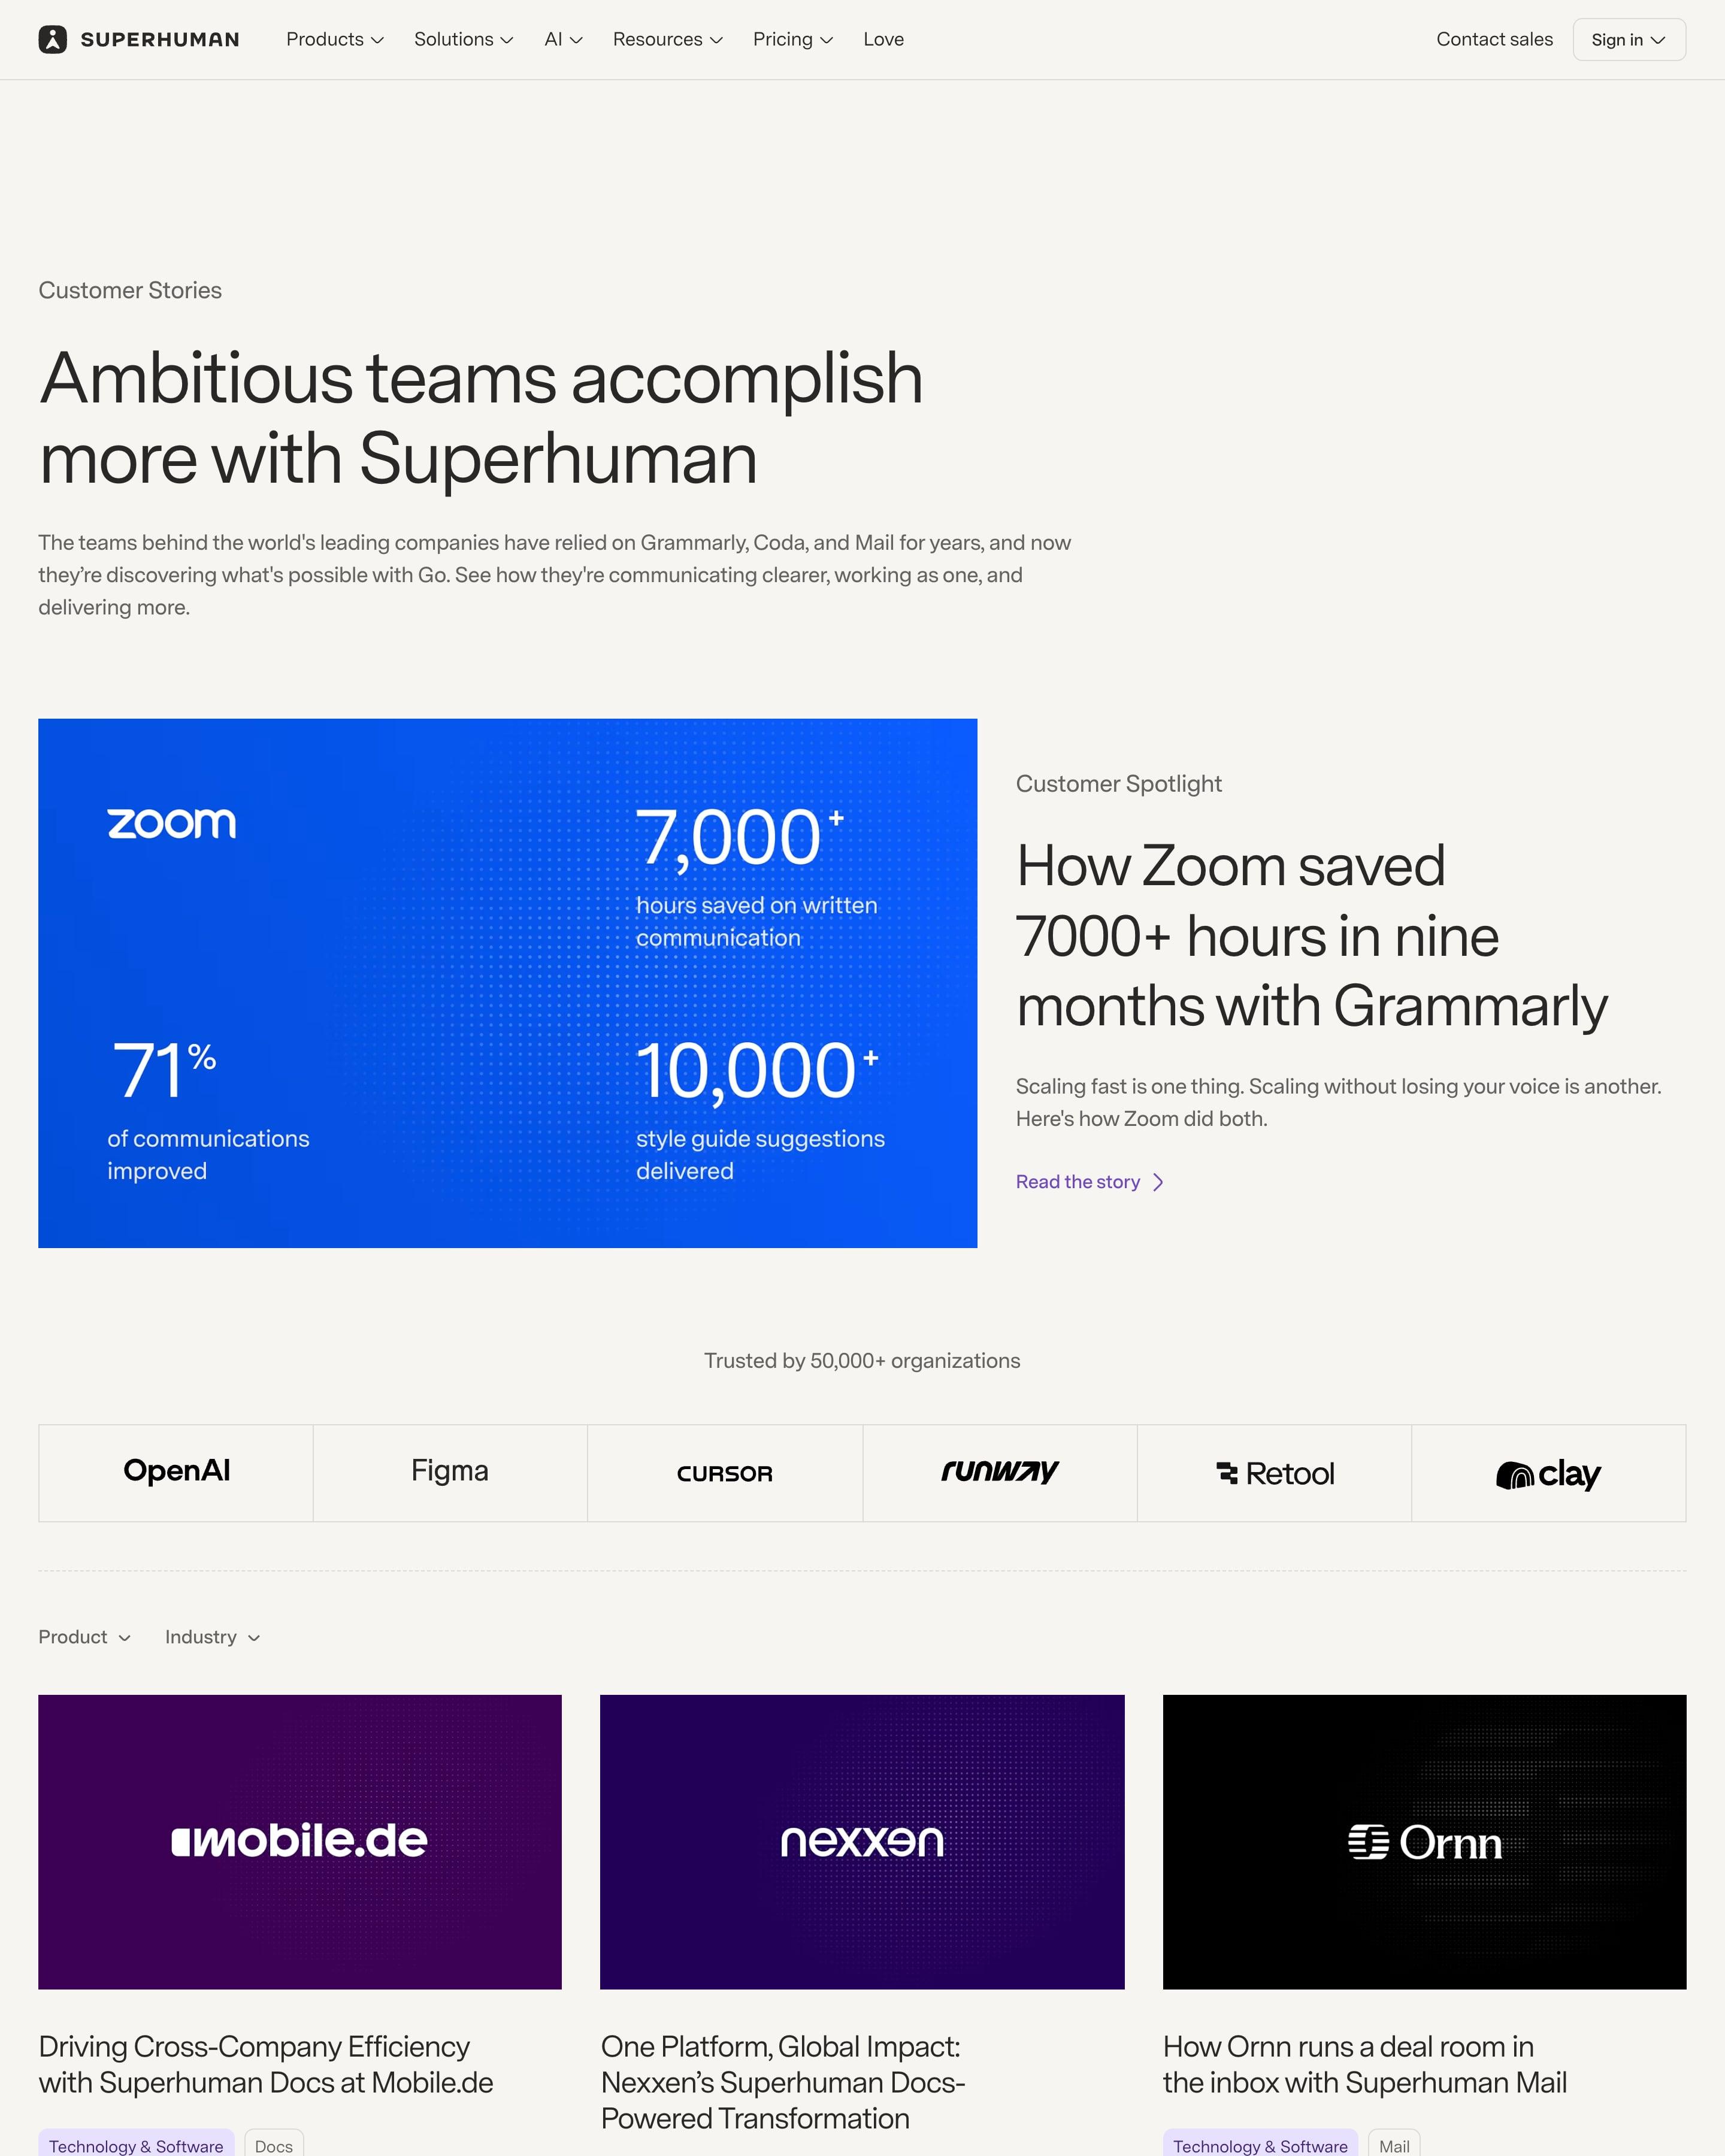
A spotlight on Zoom turns the case study into a bright blue panel of three big numbers beside its headline. Every other card is simply the customer's logo on its brand colour, an easy format to copy, tagged by industry and product and filtered with two dropdowns. A large Intercom quote splits the grid.
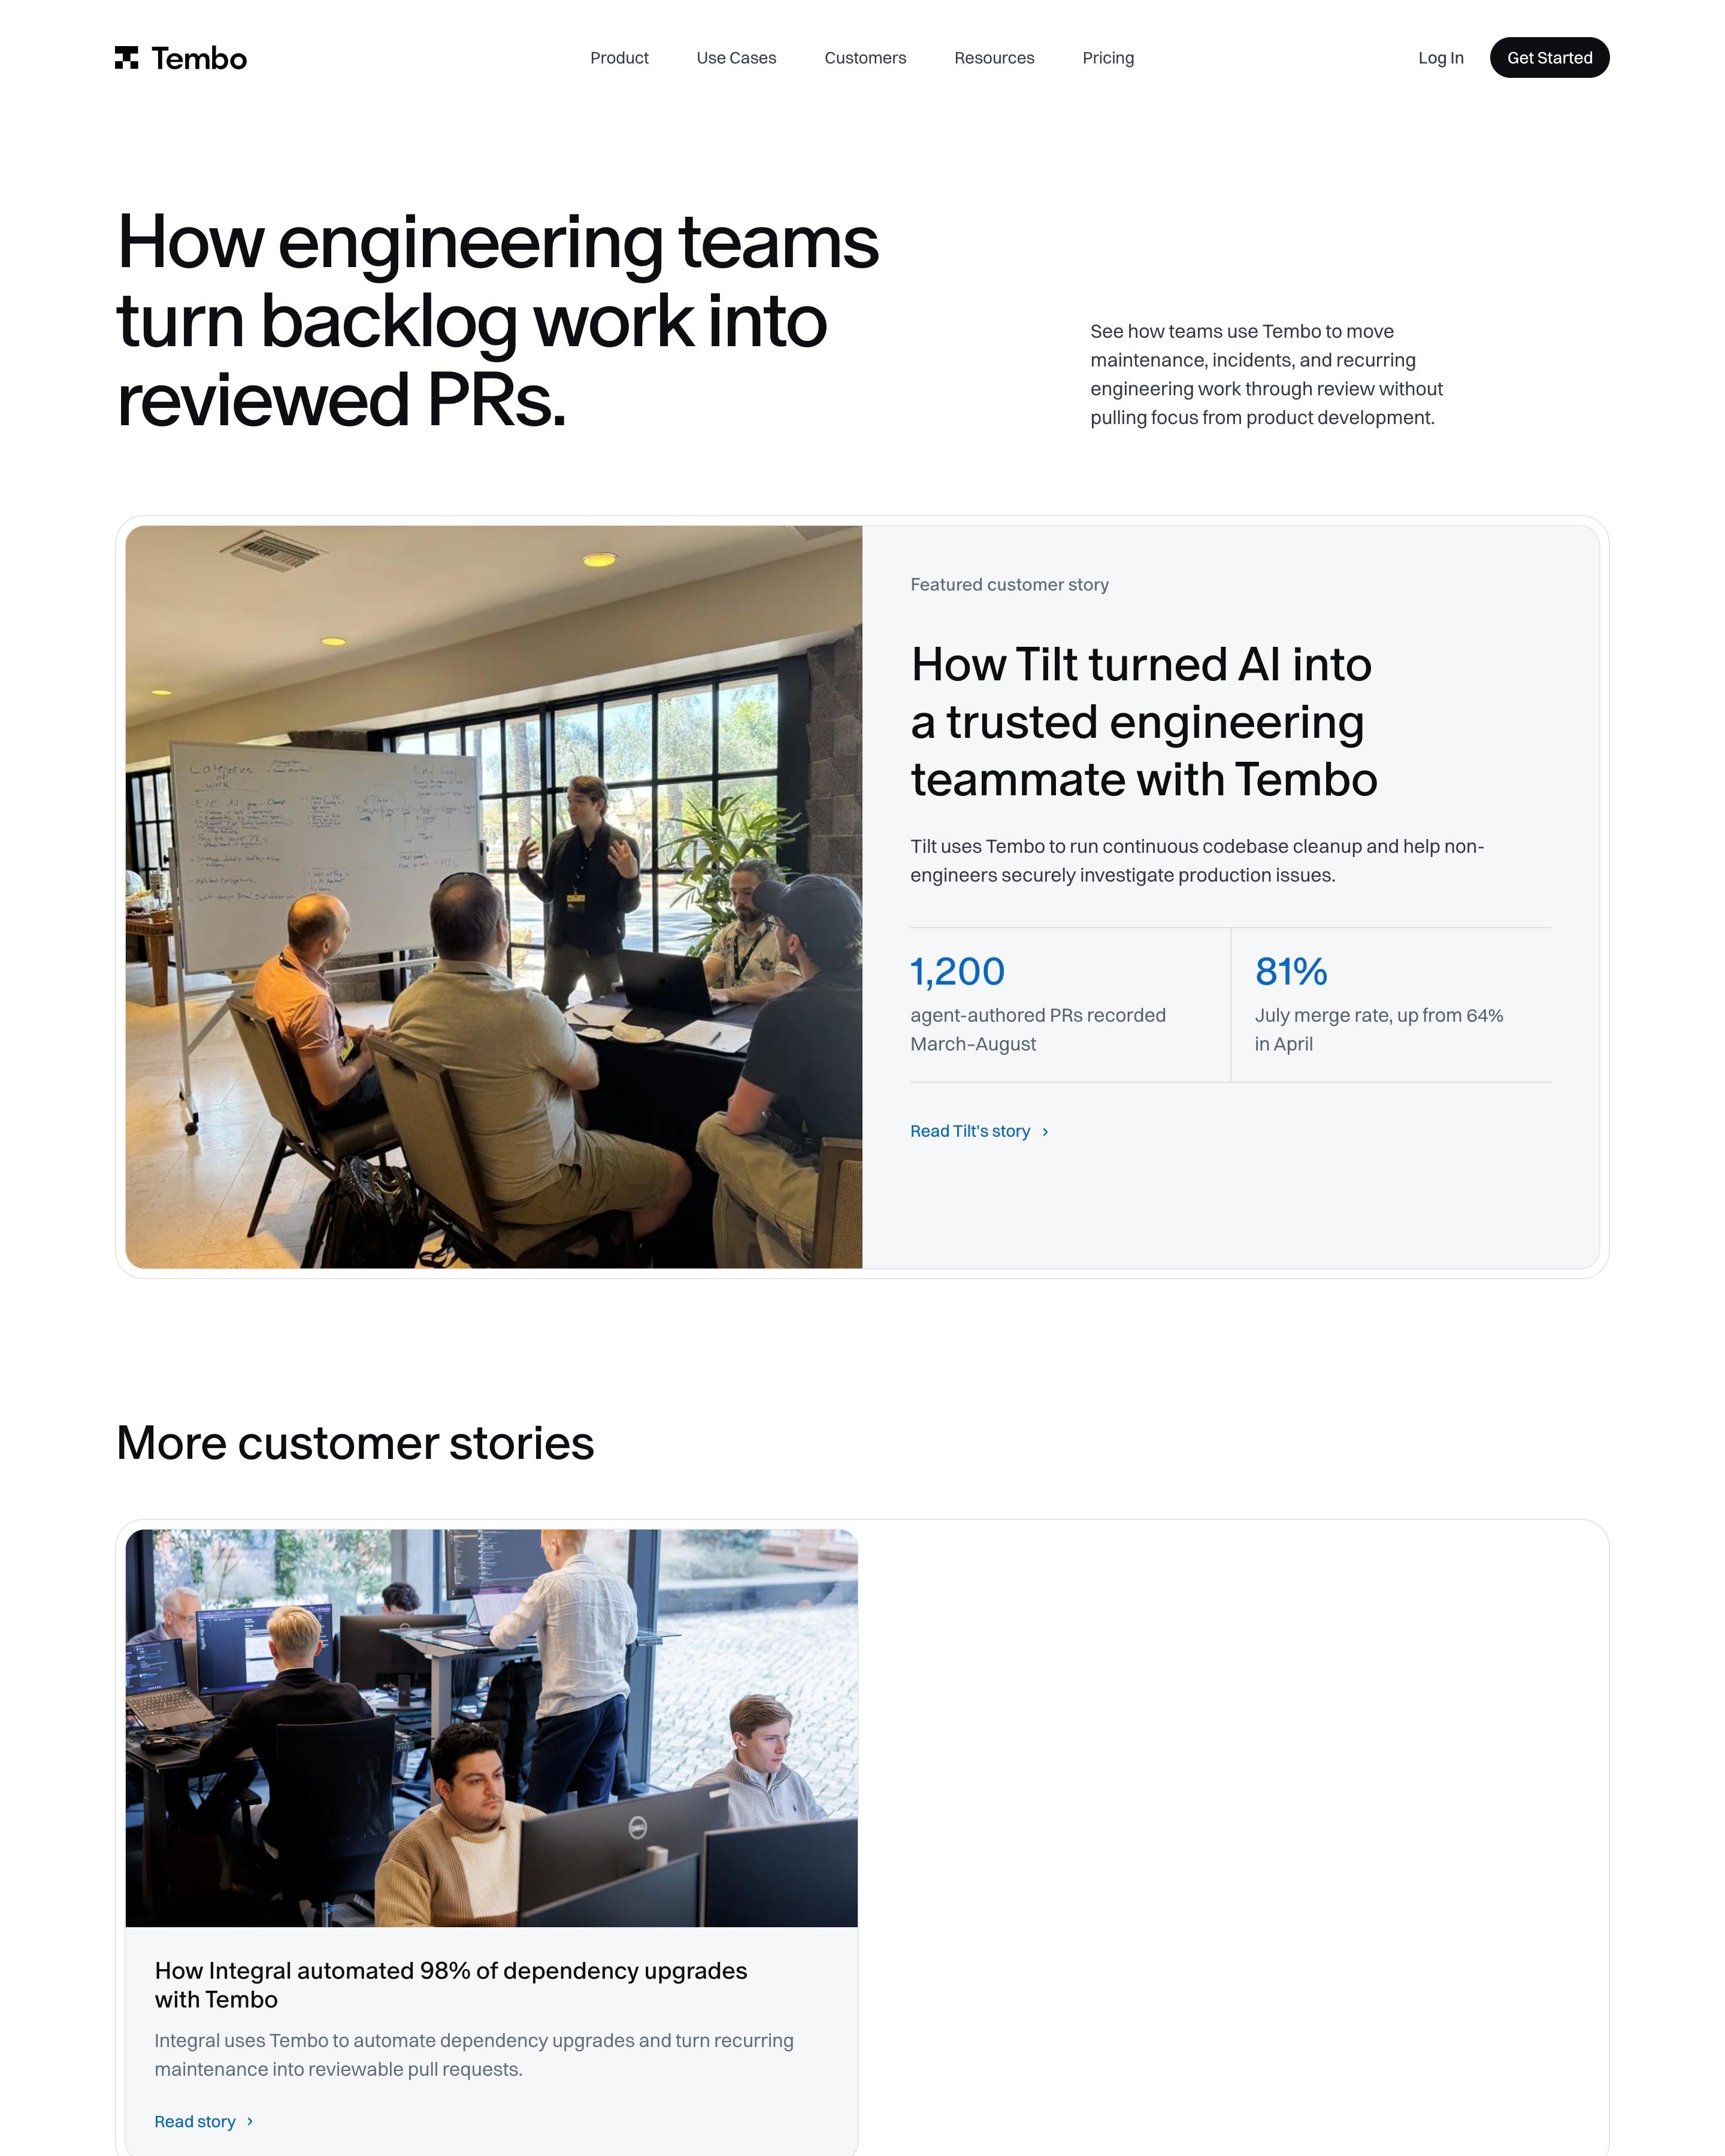
A big left-aligned headline, "How engineering teams turn backlog work into reviewed PRs.", leads to one featured Tilt story split between a meeting photo and two blue stats, 1,200 and 81%. One more story, Integral, sits in a half-width card. Logos are greyed out in a ten-cell grid, and the CTA reuses the frosted blue glass tiles seen across the site.
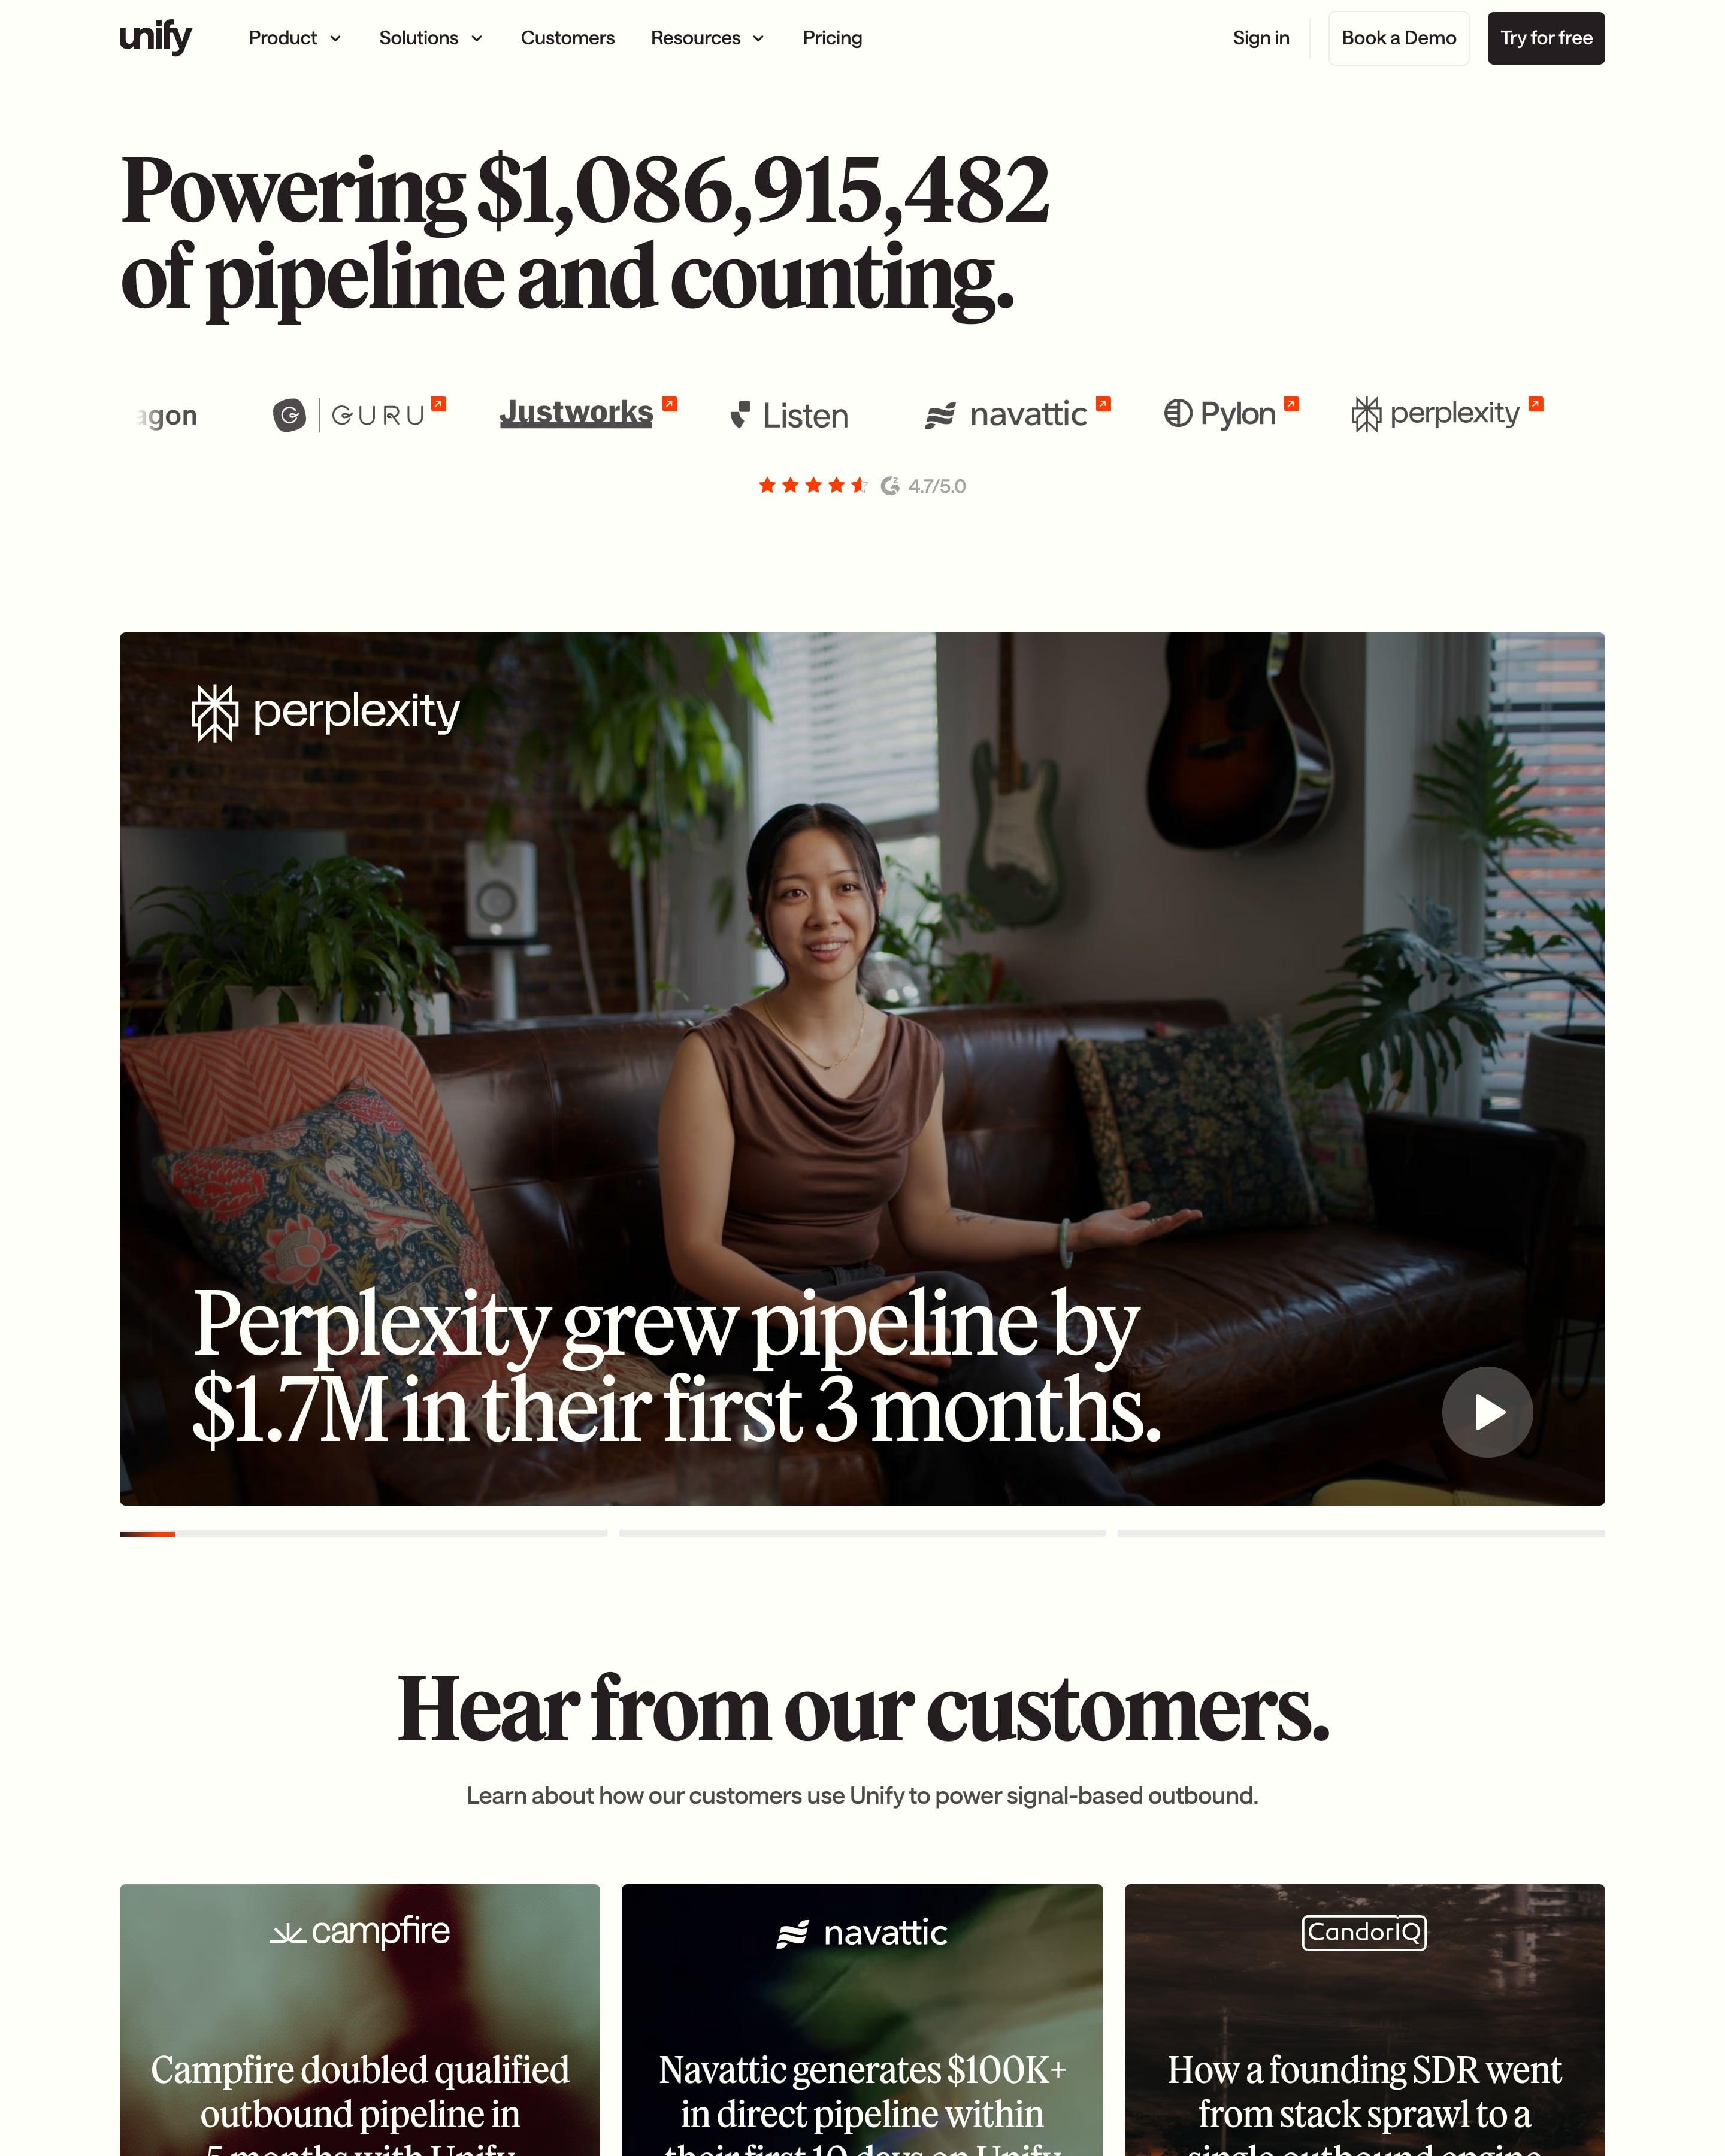
The pipeline counter returns as the headline, "Powering $1,086,915,482 of pipeline and counting", over a video carousel led by Perplexity's "$1.7M in their first 3 months". Nine story cards follow, each a dark blurred photo with a white logo and a centred serif result. A "Go-to-Market Grammy's" banner breaks things up before a three-column masonry of quote cards, every one topped by a company logo.
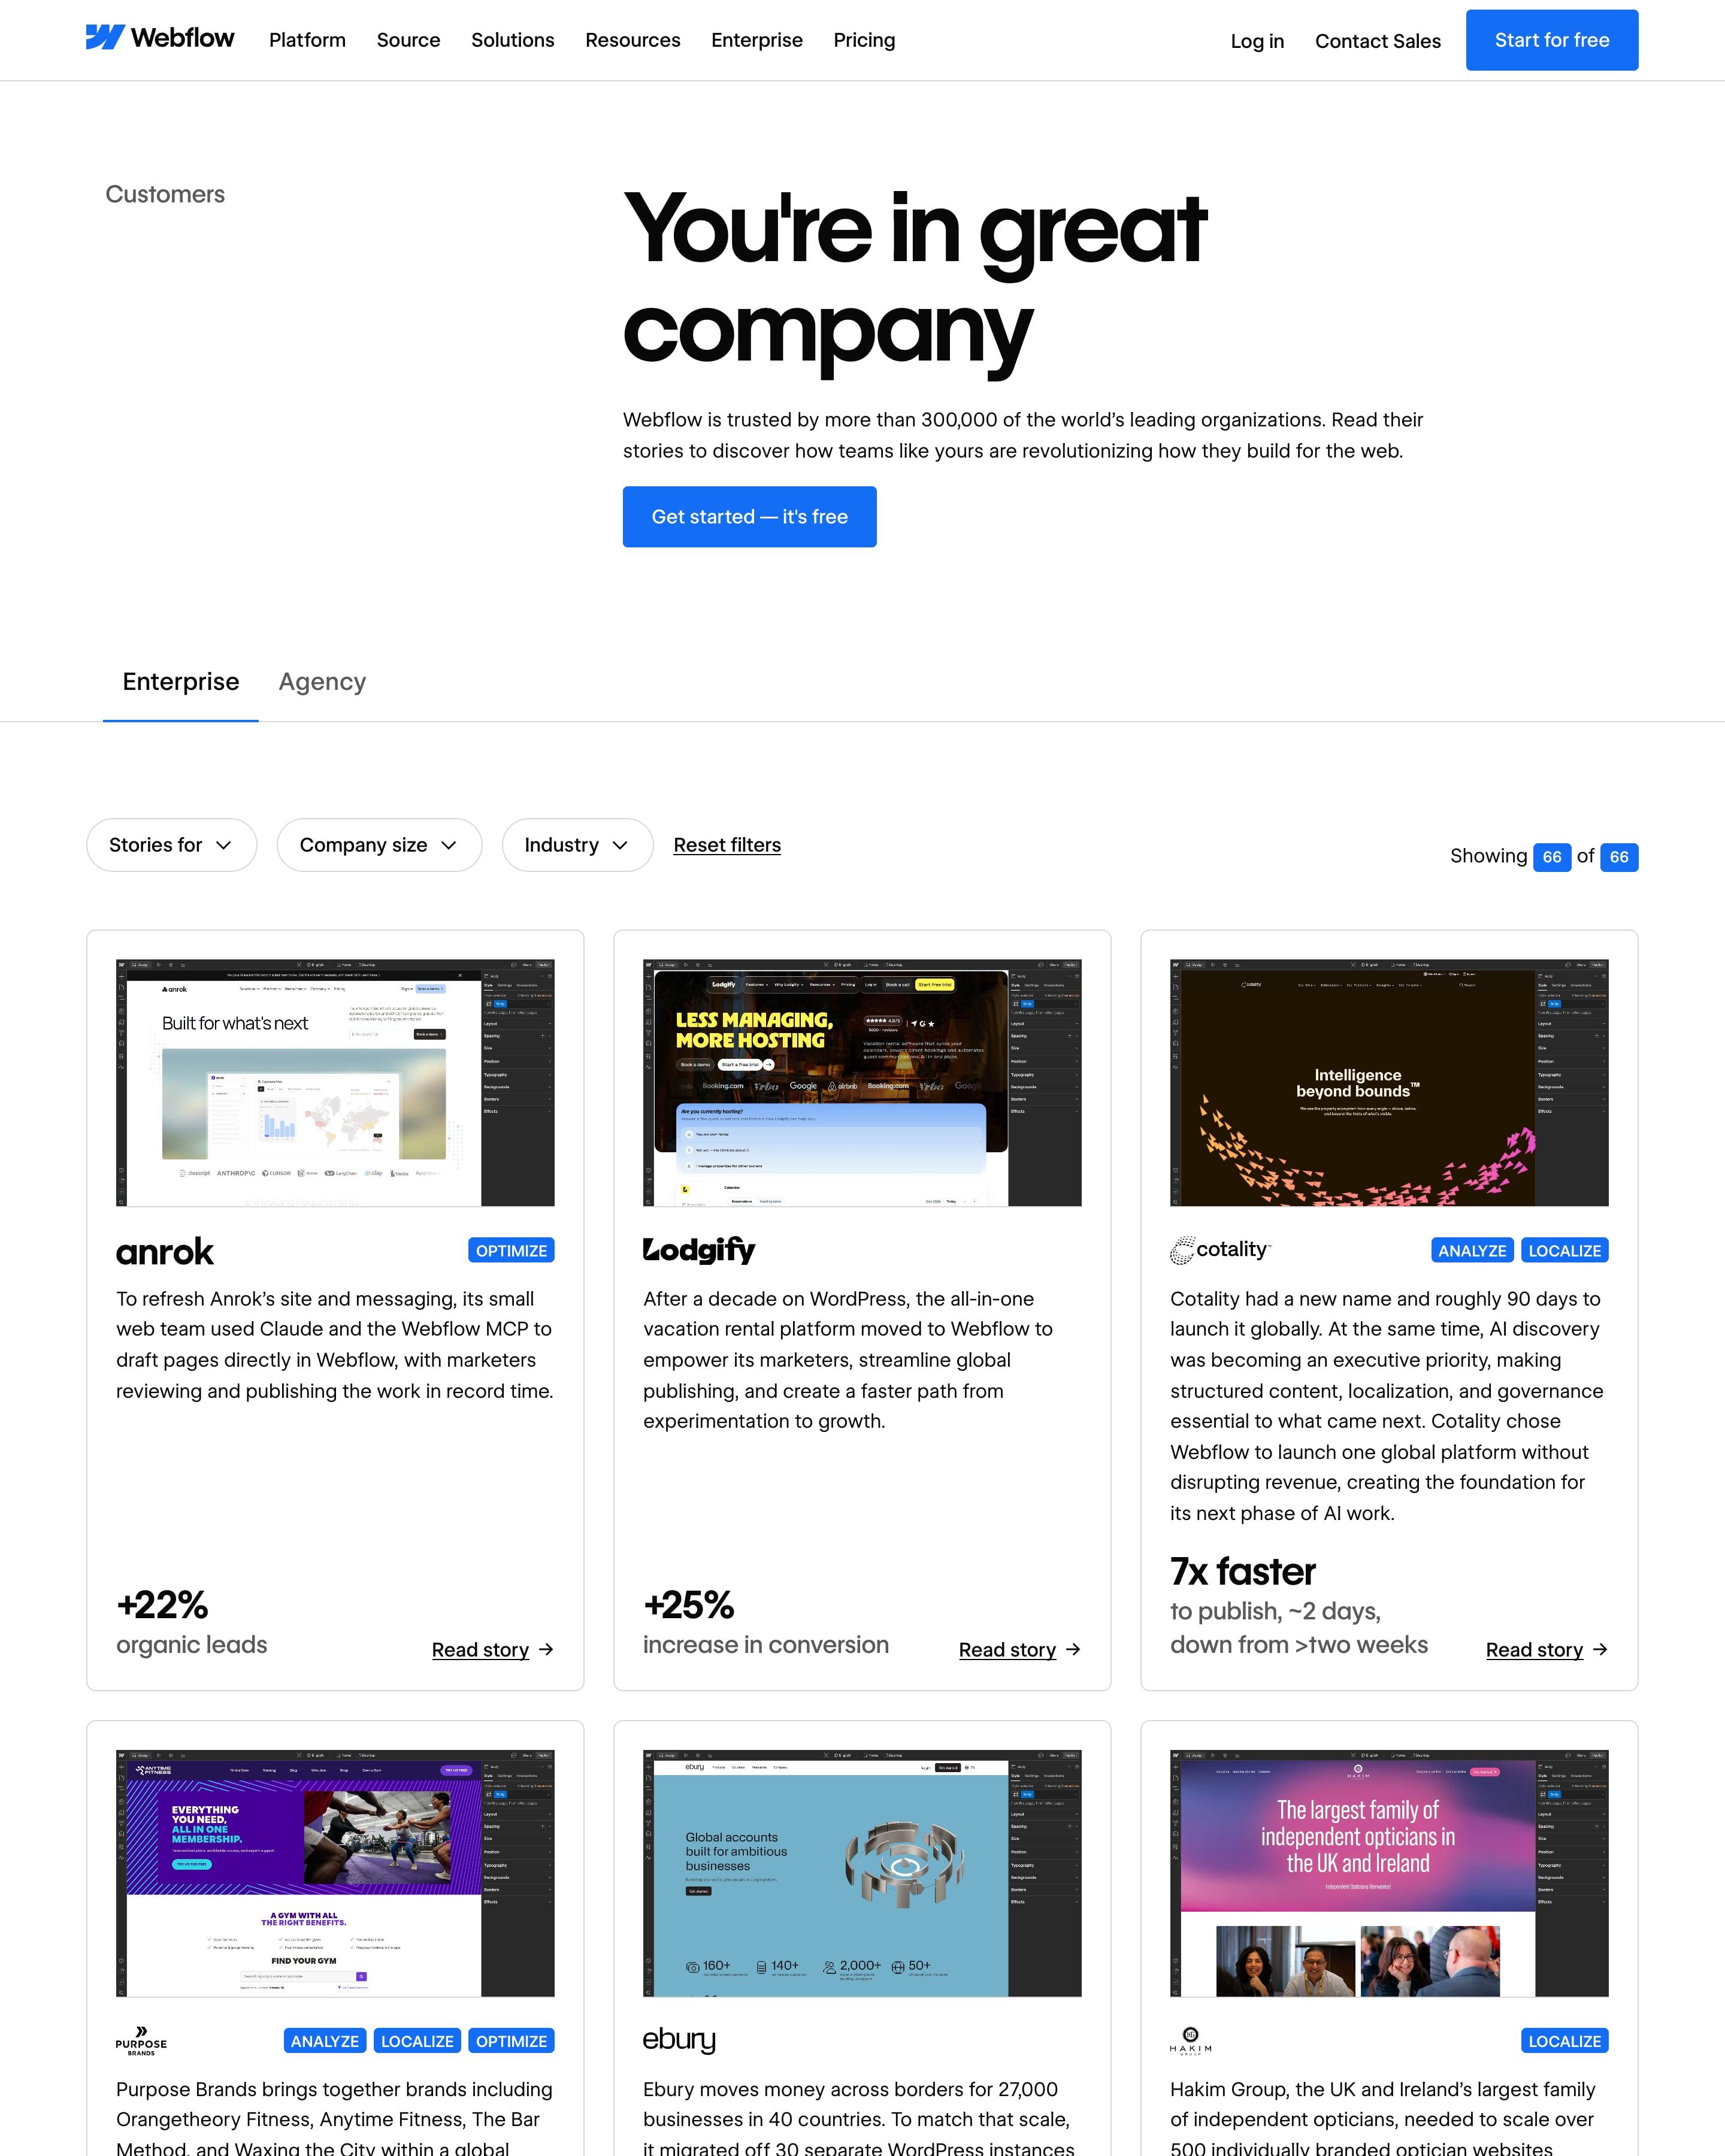
Each story card frames the customer's site inside the Webflow editor, then adds product tags, a summary and one large result such as "+22% organic leads". Enterprise and Agency tabs sit over three filter dropdowns and a "Showing 66 of 66" count. The in-editor screenshots are the idea to take.
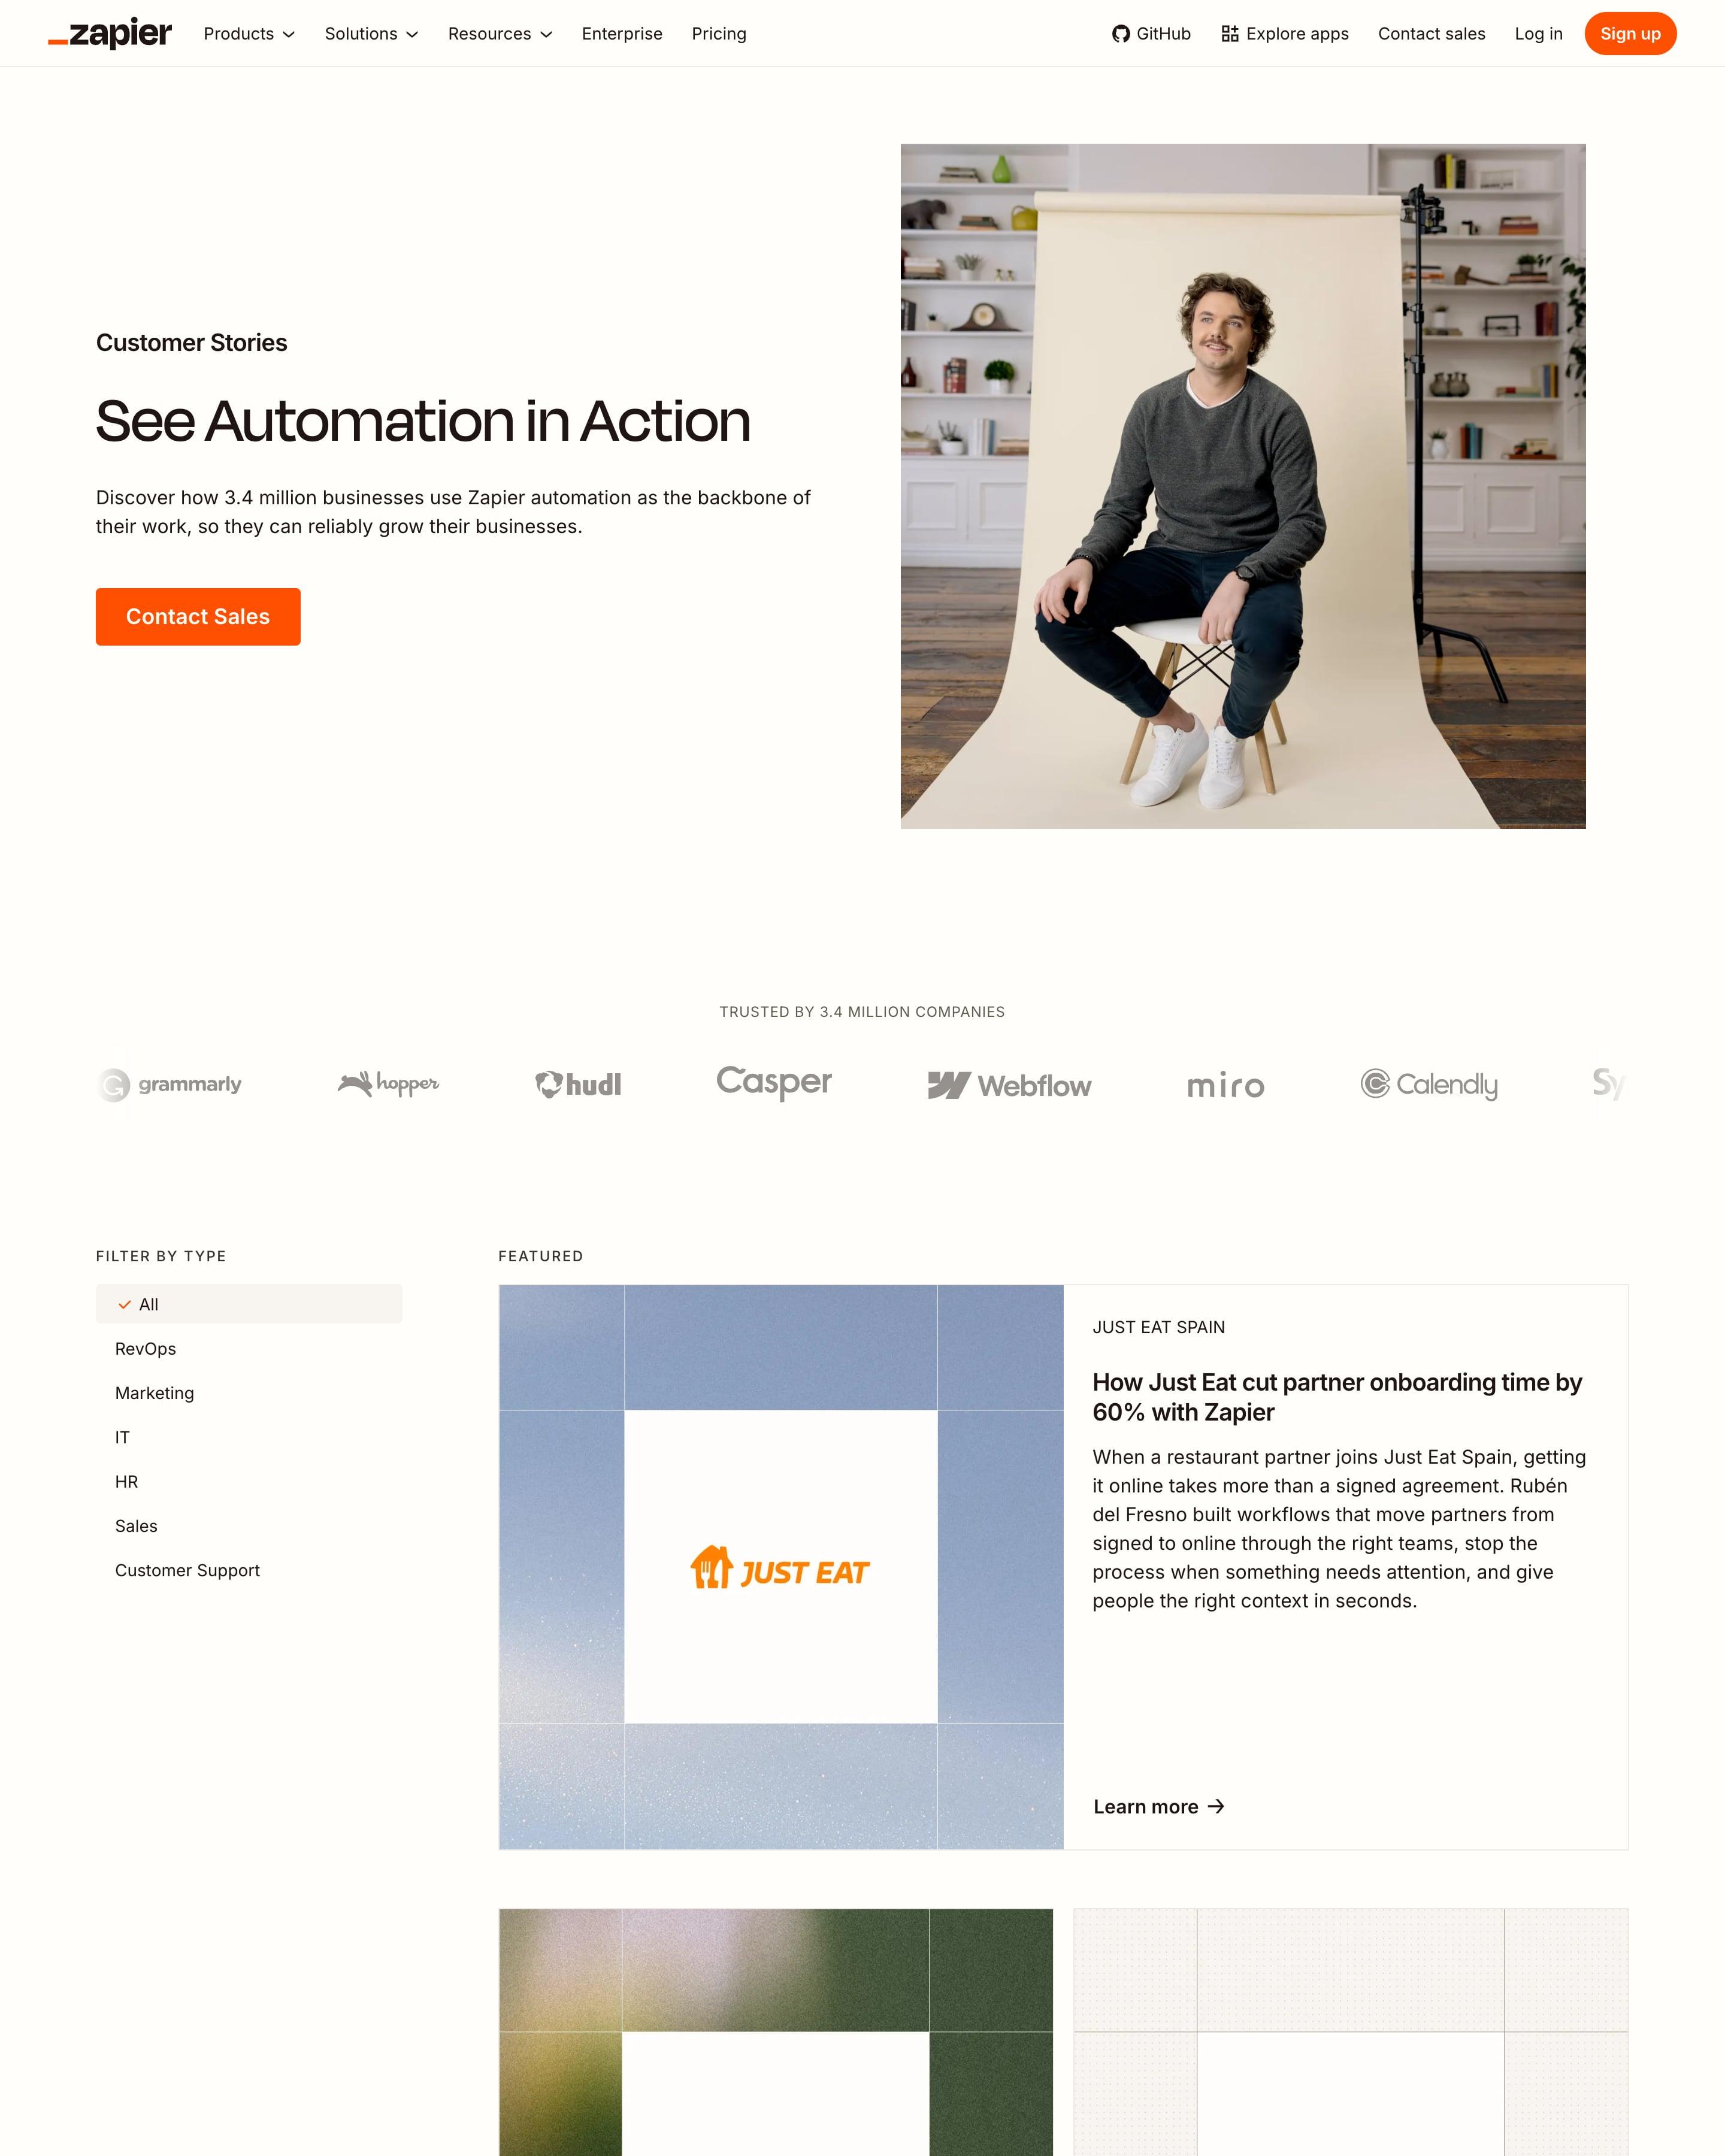
A studio portrait of a man on a chair opens the page. Stories then run in a two-column feed, each cover a customer logo over a blurred photo or flat colour, an easy style to copy, with a 'How …' headline and summary. A category list sits on the left.
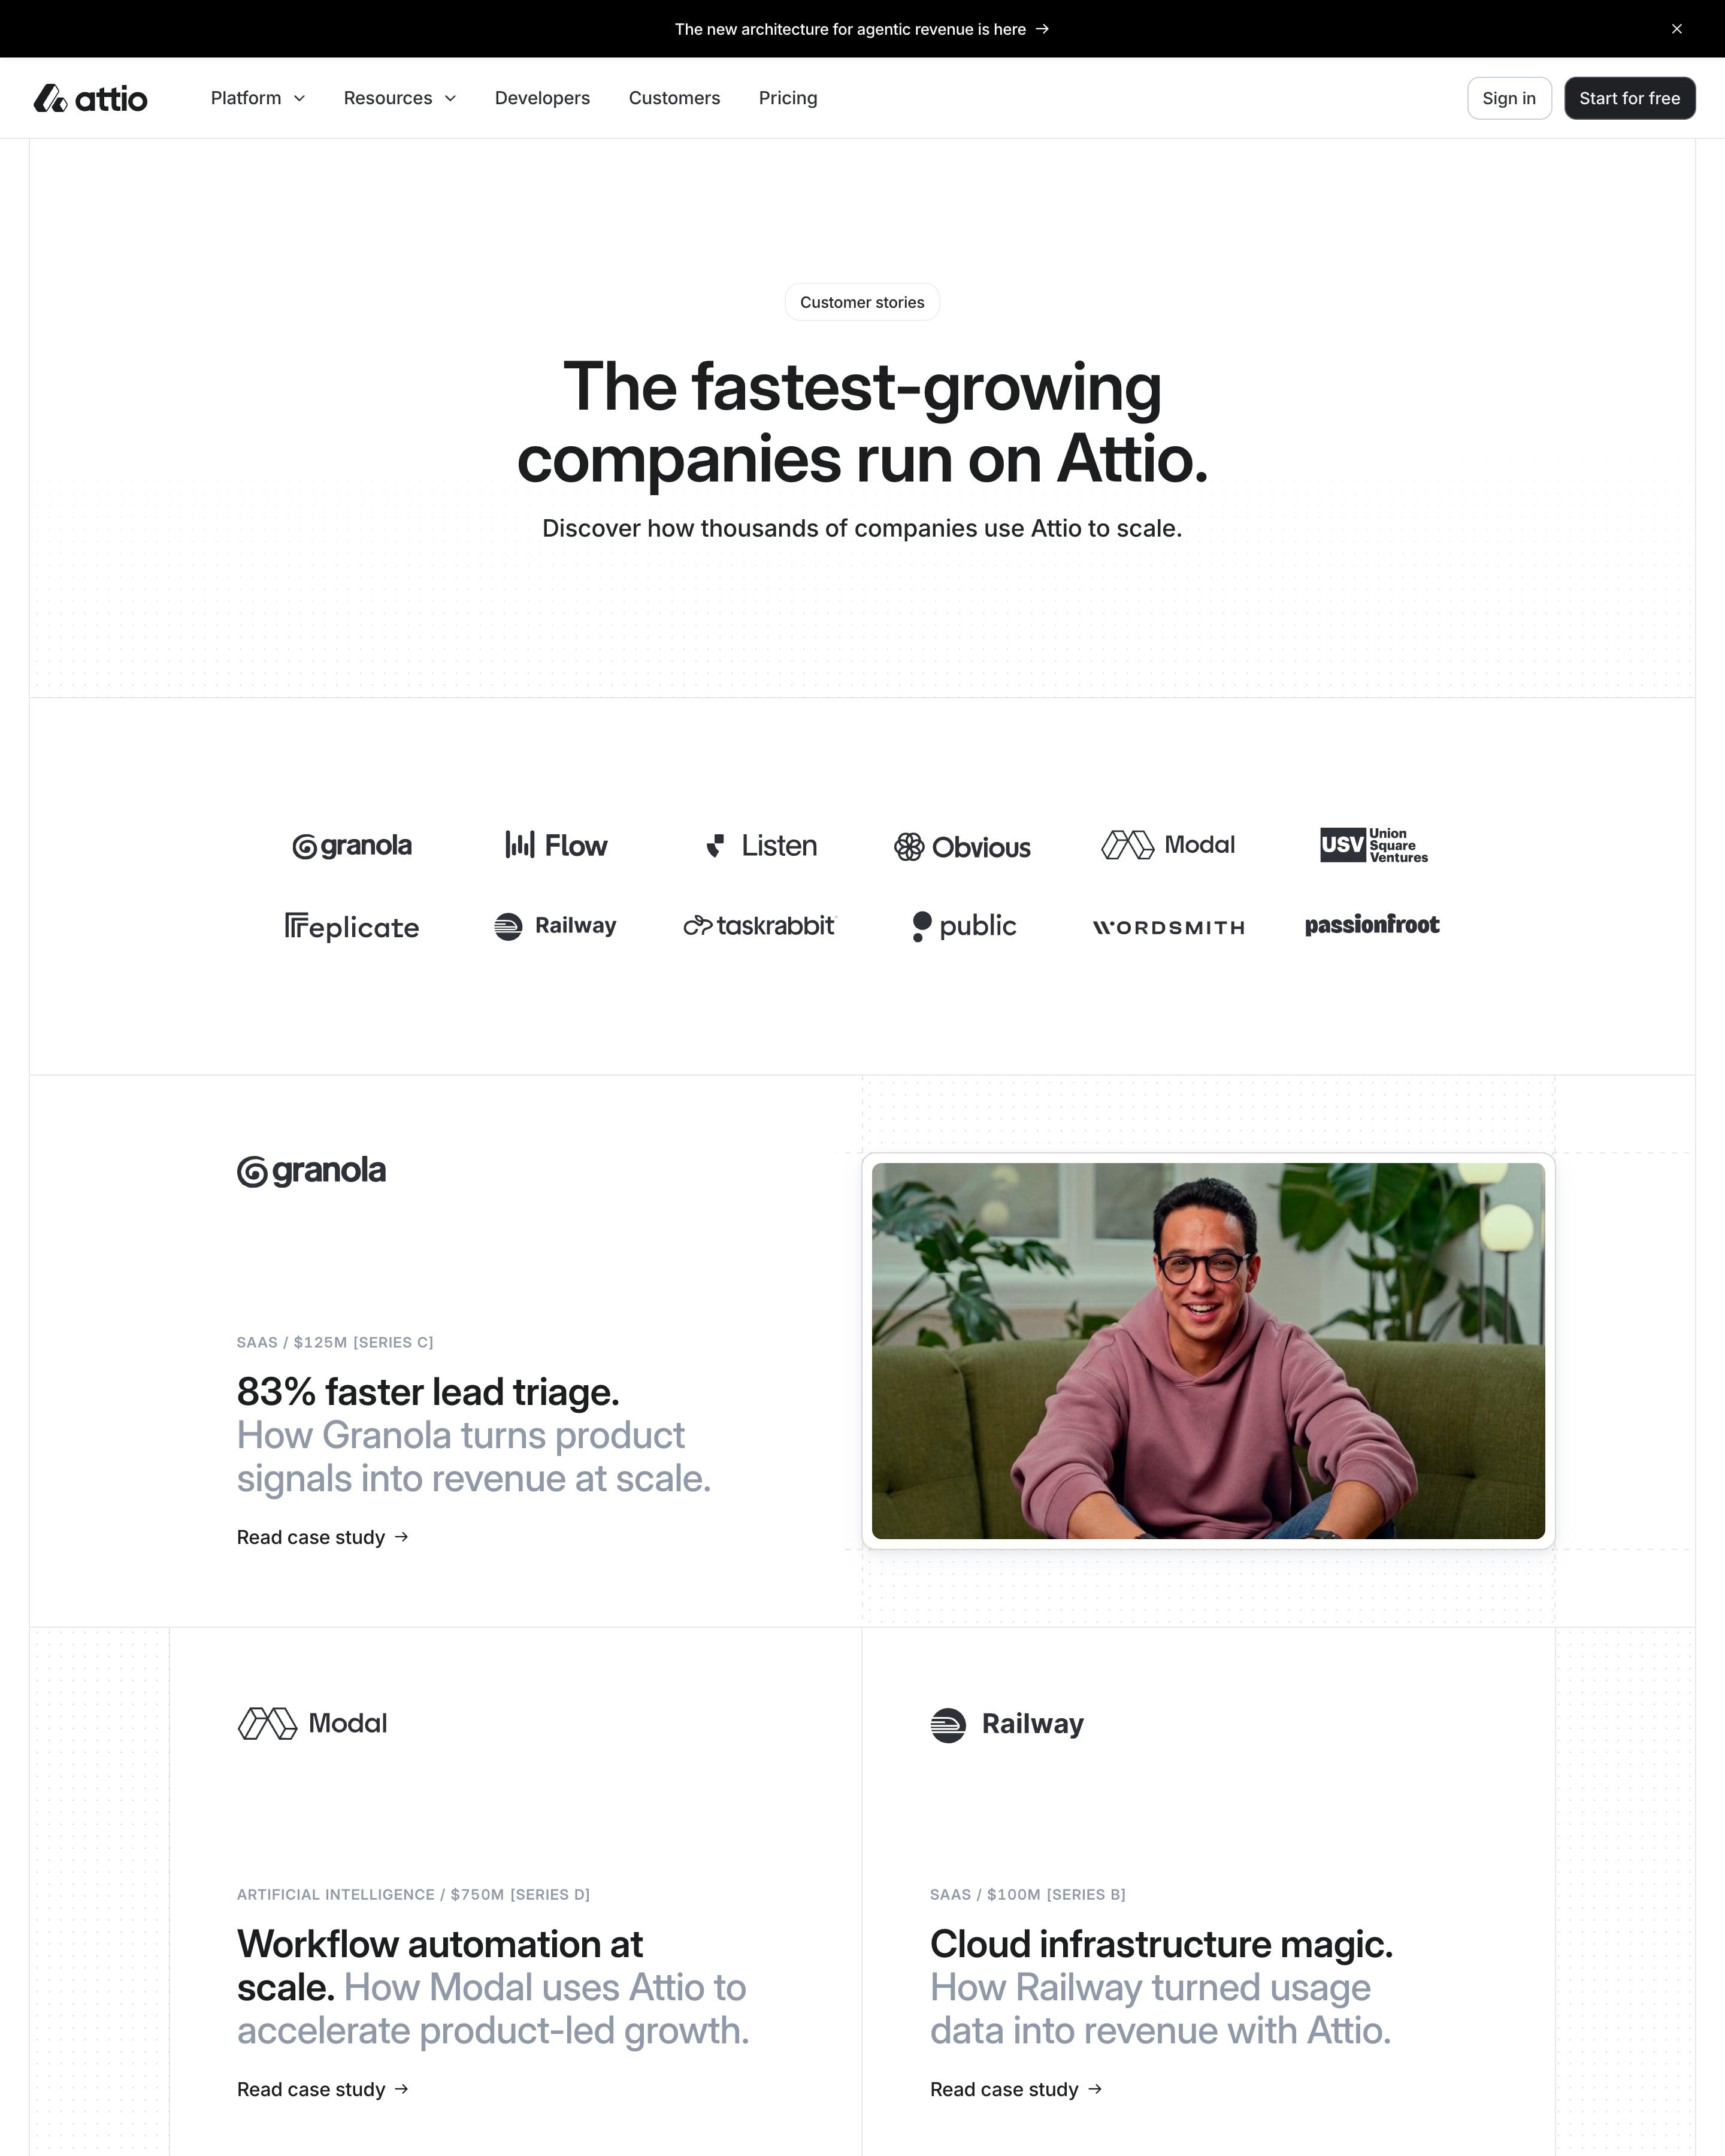
Each story headline states a result in black, like "83% faster lead triage", then explains how in grey, under a small sector-and-funding label. Photo rows alternate with two-up text cards on a hairline grid. Near the end, an ink-drawn portrait beside a serif quote is a hand-made touch worth copying.
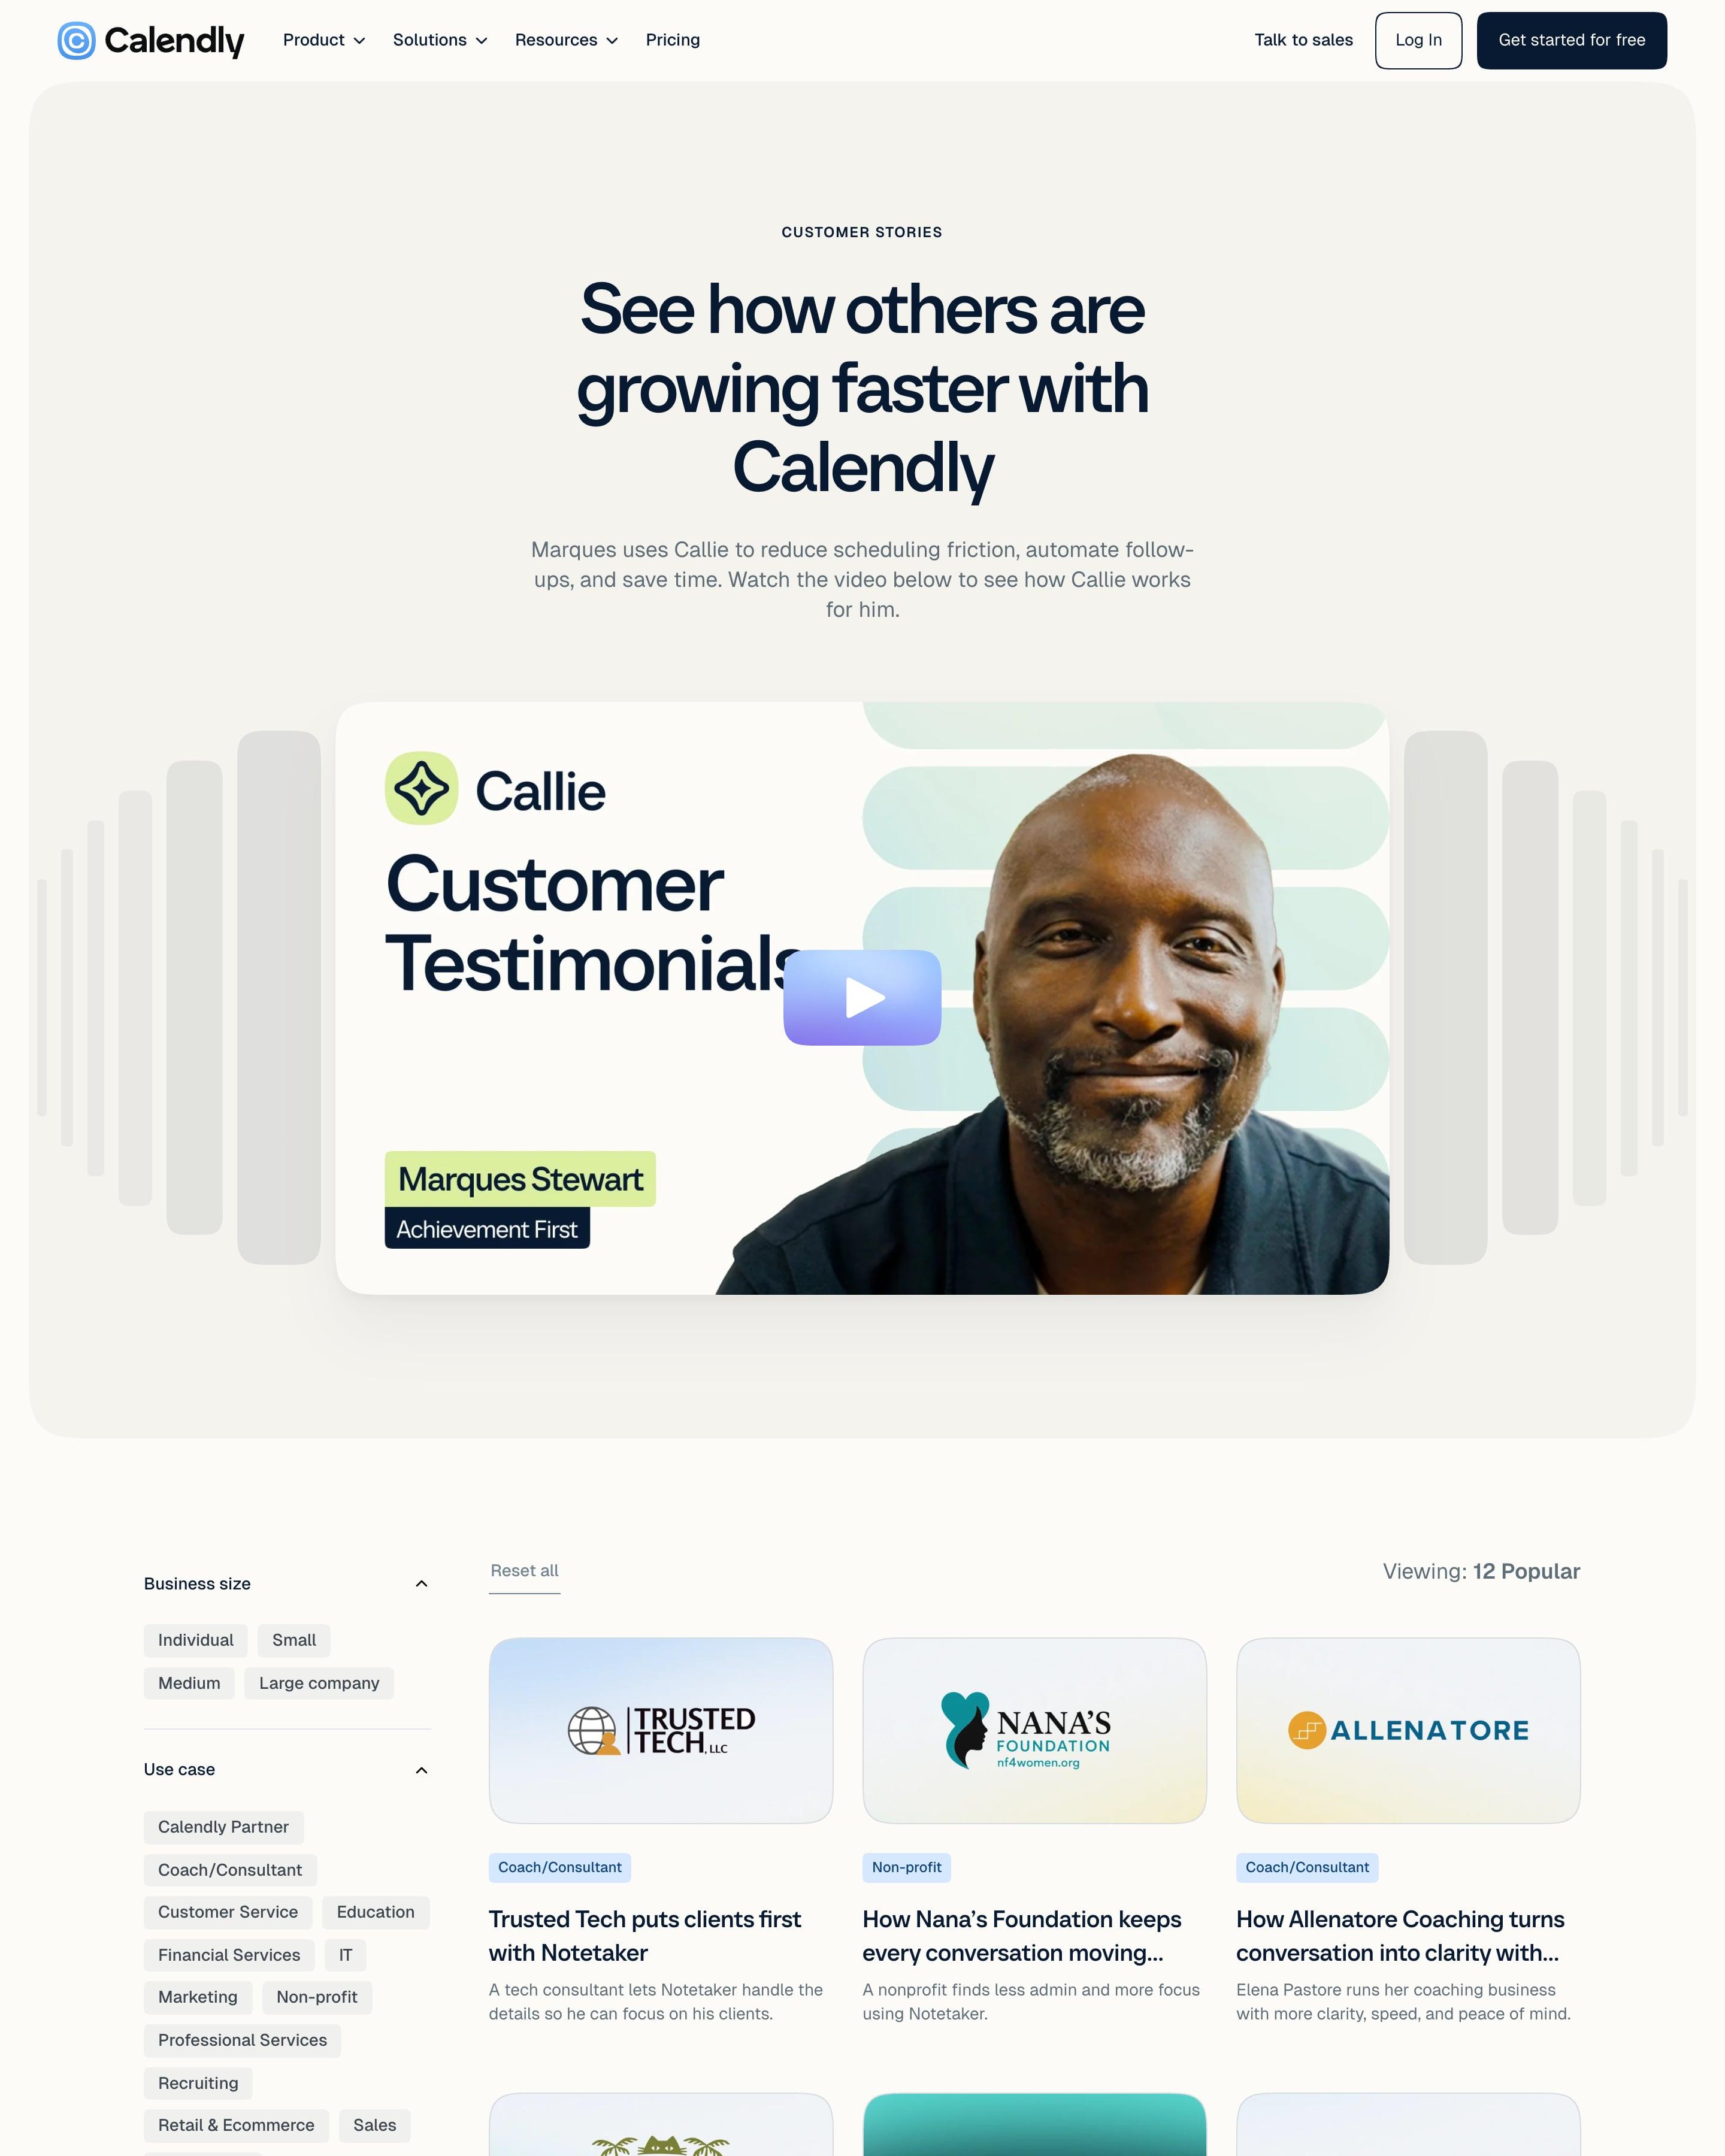
"See how others are growing faster with Calendly" leads into a video testimonial from Marques Stewart, framed by stacks of grey bars and a lime name tag. Below, a sidebar filters by business size, use case and feature, beside a three-column grid of small businesses like Kitty of Angels and SKYDOG. Each cover sets the logo on a soft gradient, a tidy way to unify mixed brands.
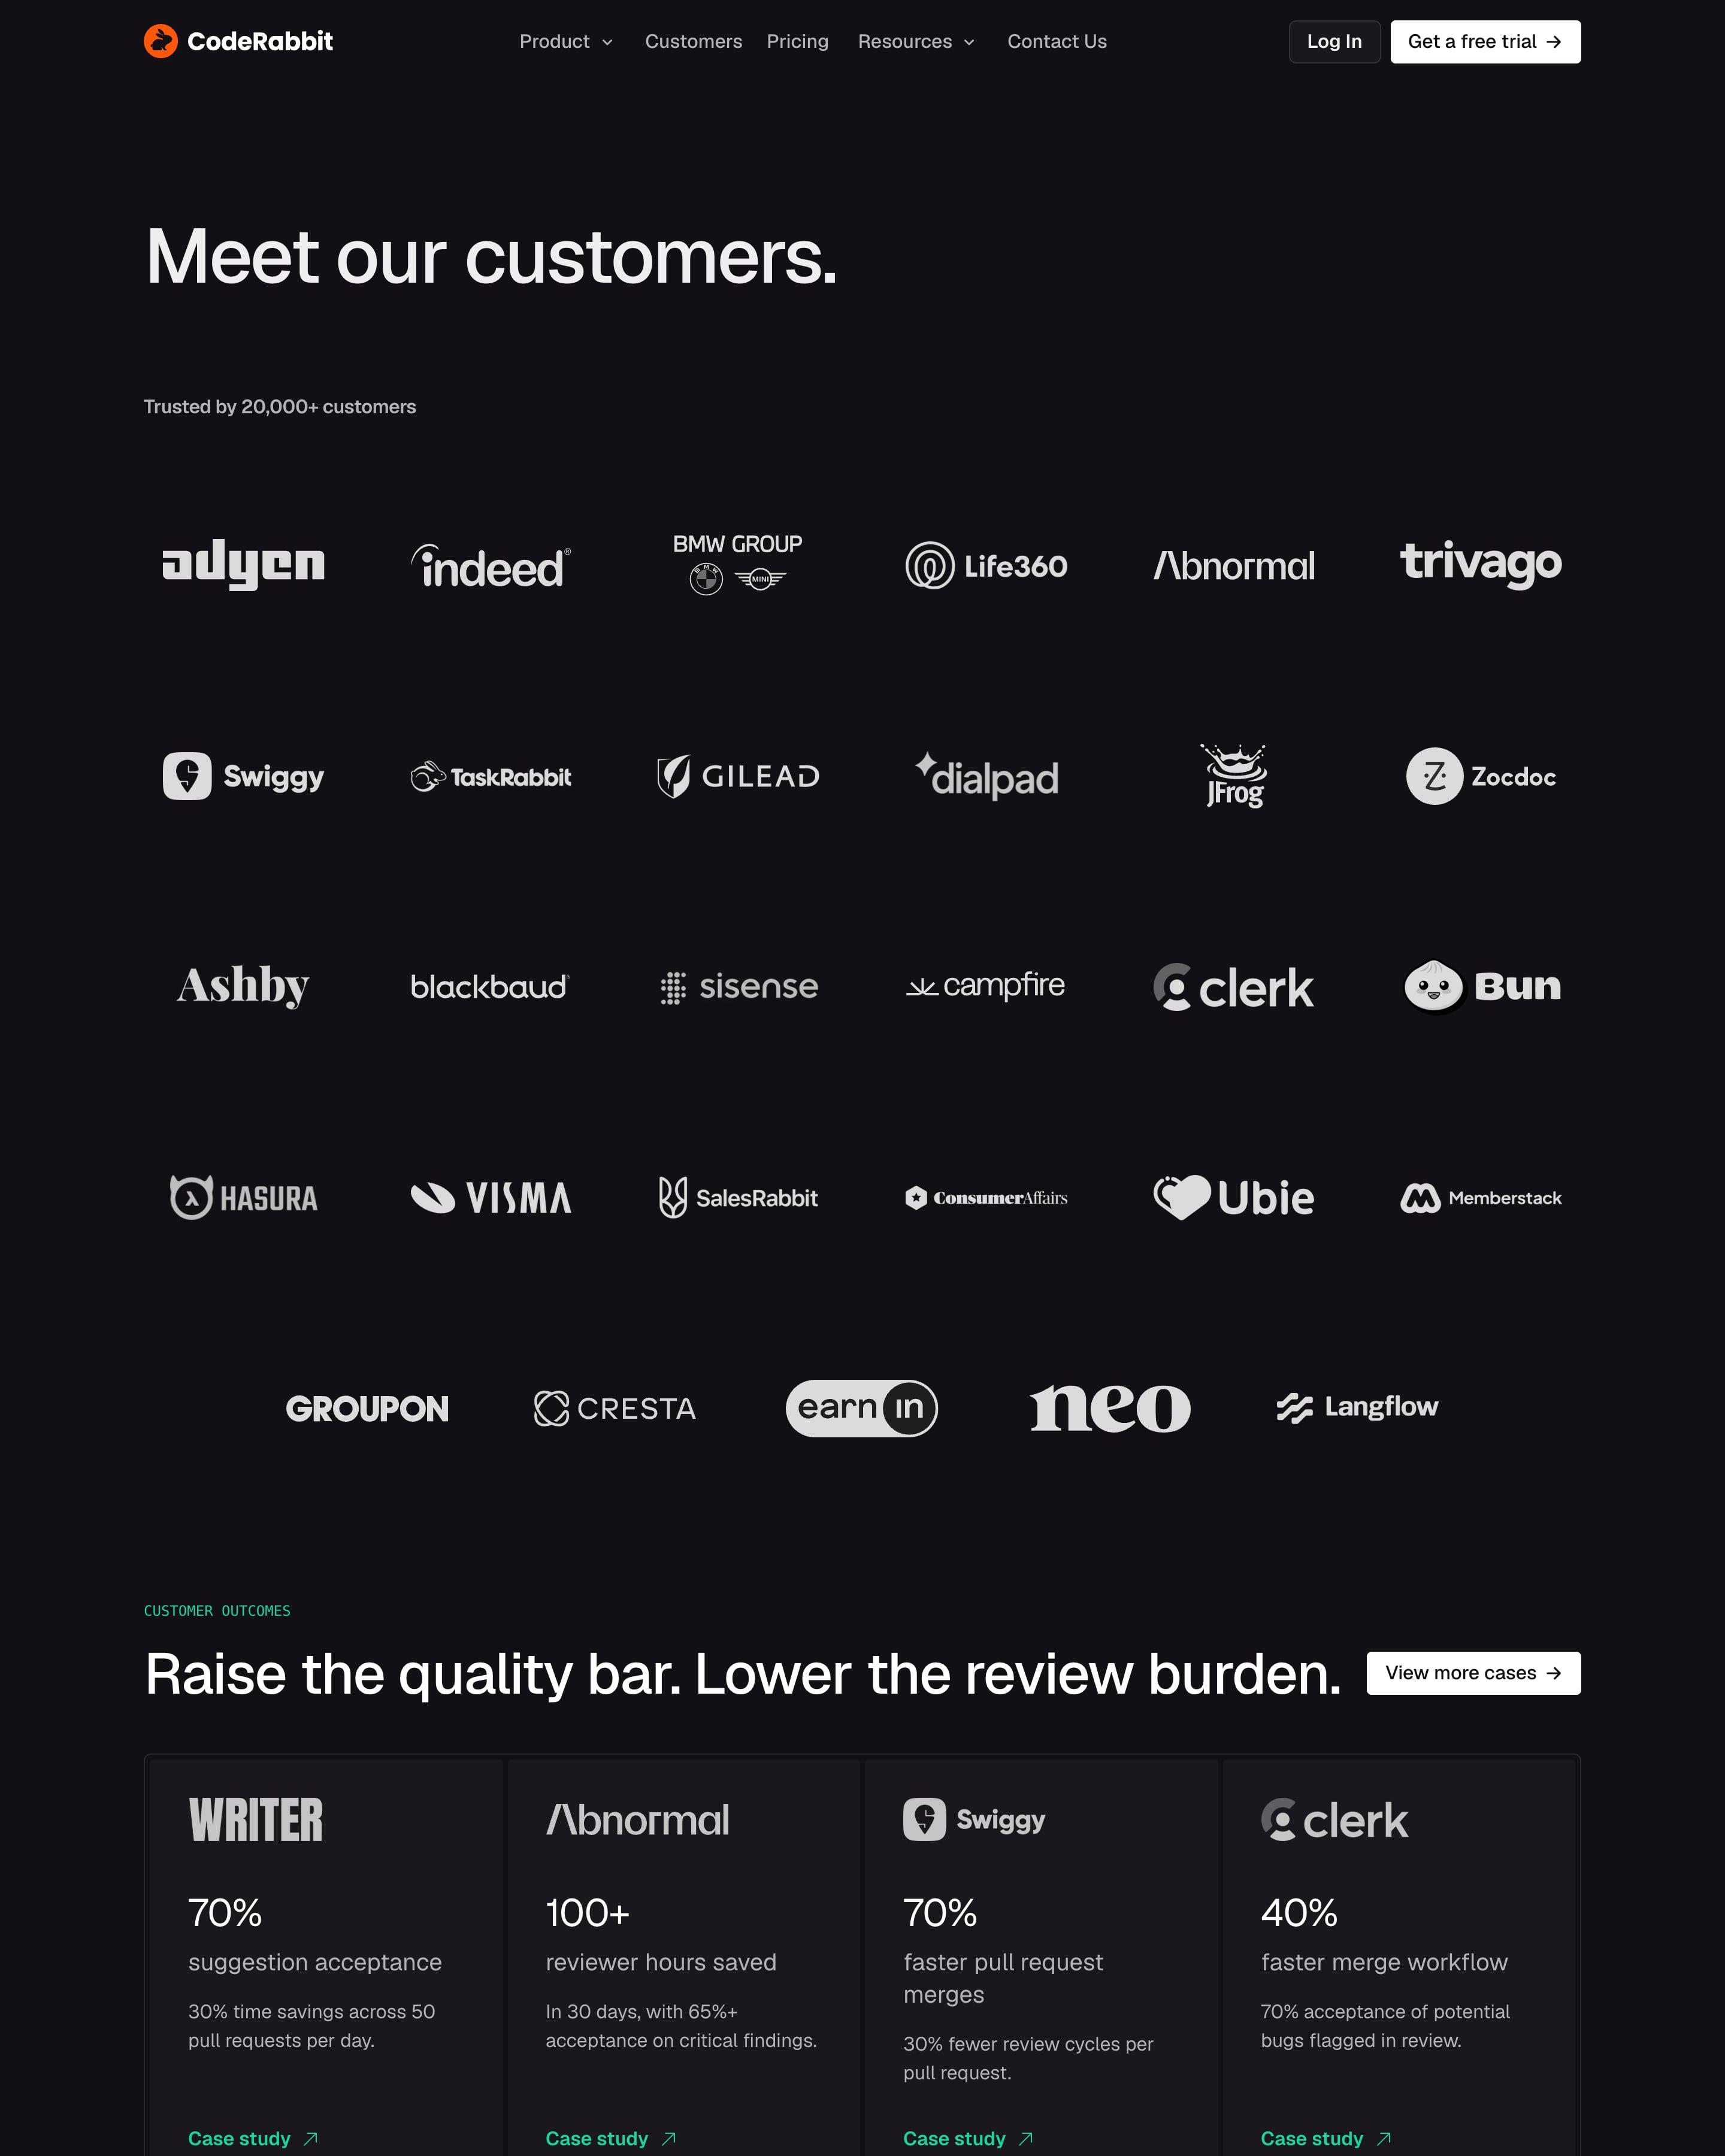
A plain "Meet our customers." heading leads into a six-column wall of white logos on near-black, from adyen and Indeed to Bun and Langflow. Four outcome cards follow, each a logo, one big figure such as "100+ reviewer hours saved" and a green "Case study" link. Five long quotes in bordered boxes close it, above a "Get started in 2 clicks." bar with a multicolour line along its bottom edge.
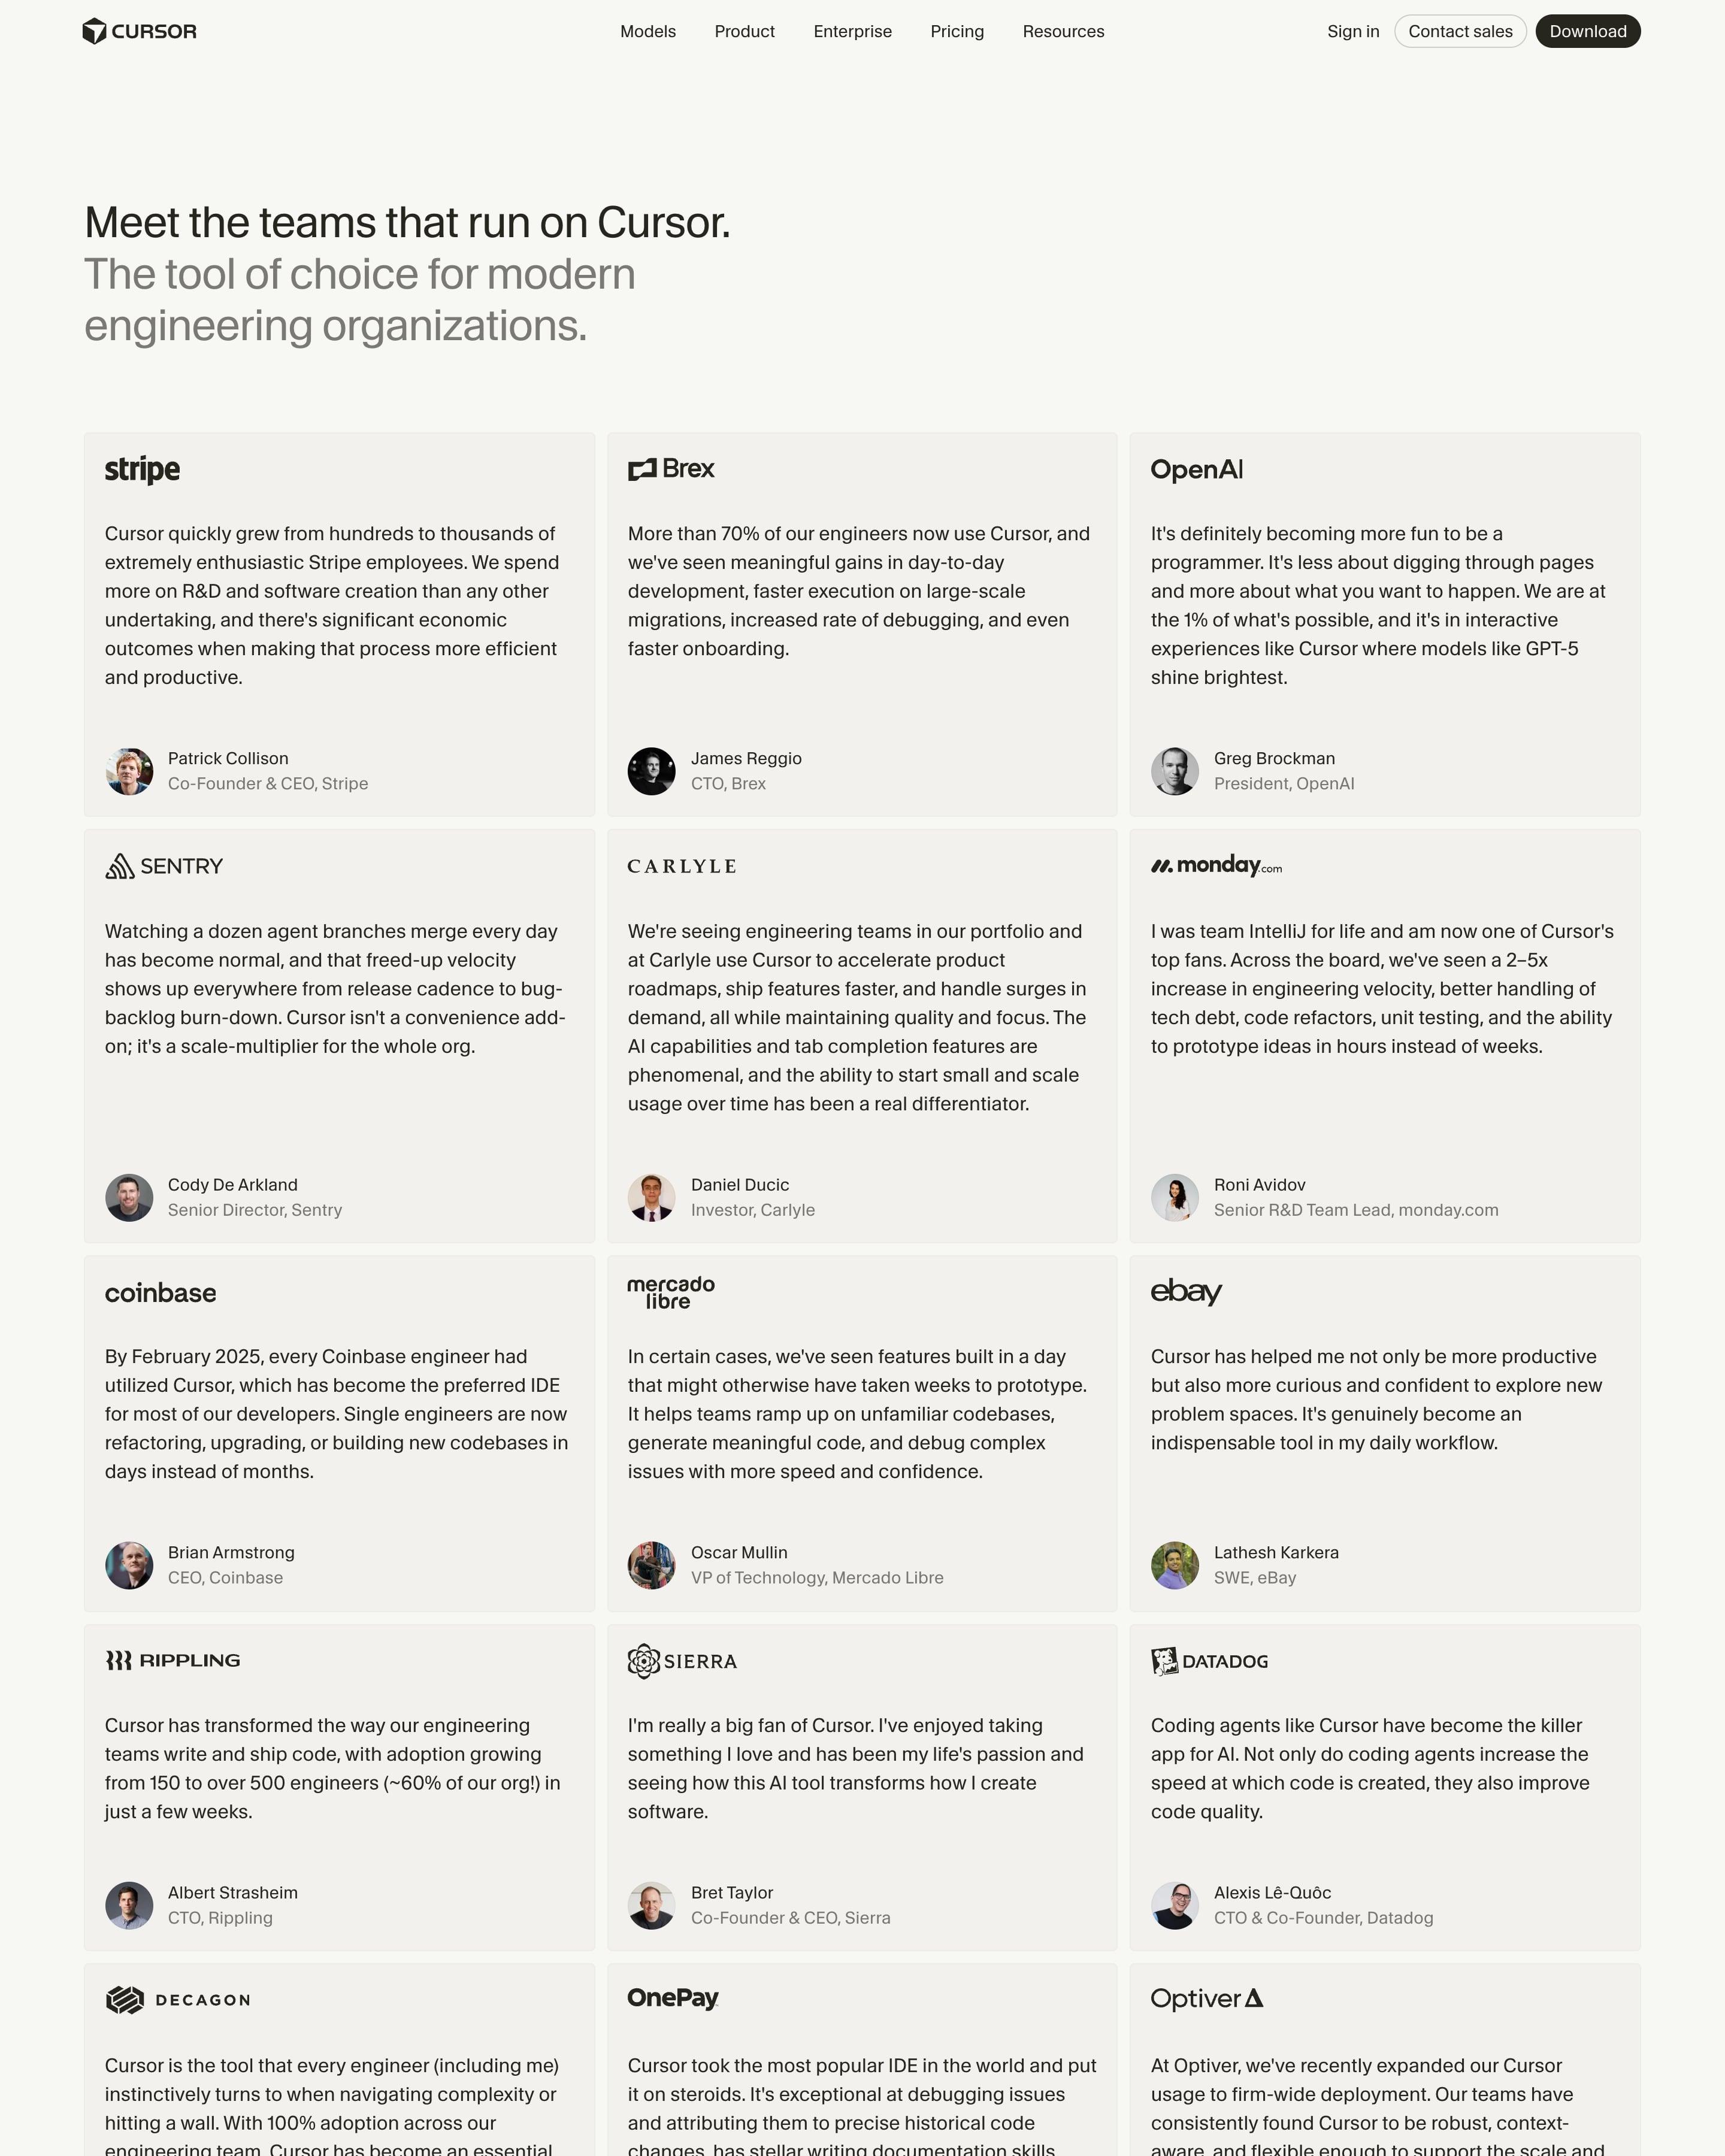
Under a black-and-grey headline sits a three-column grid of quote cards, each opening with the company's logo, then the quote, then a face, name and title. A wall of grey logo tiles, eight across, follows. There are no stats or filters, and the logo-first card is a format worth reusing.
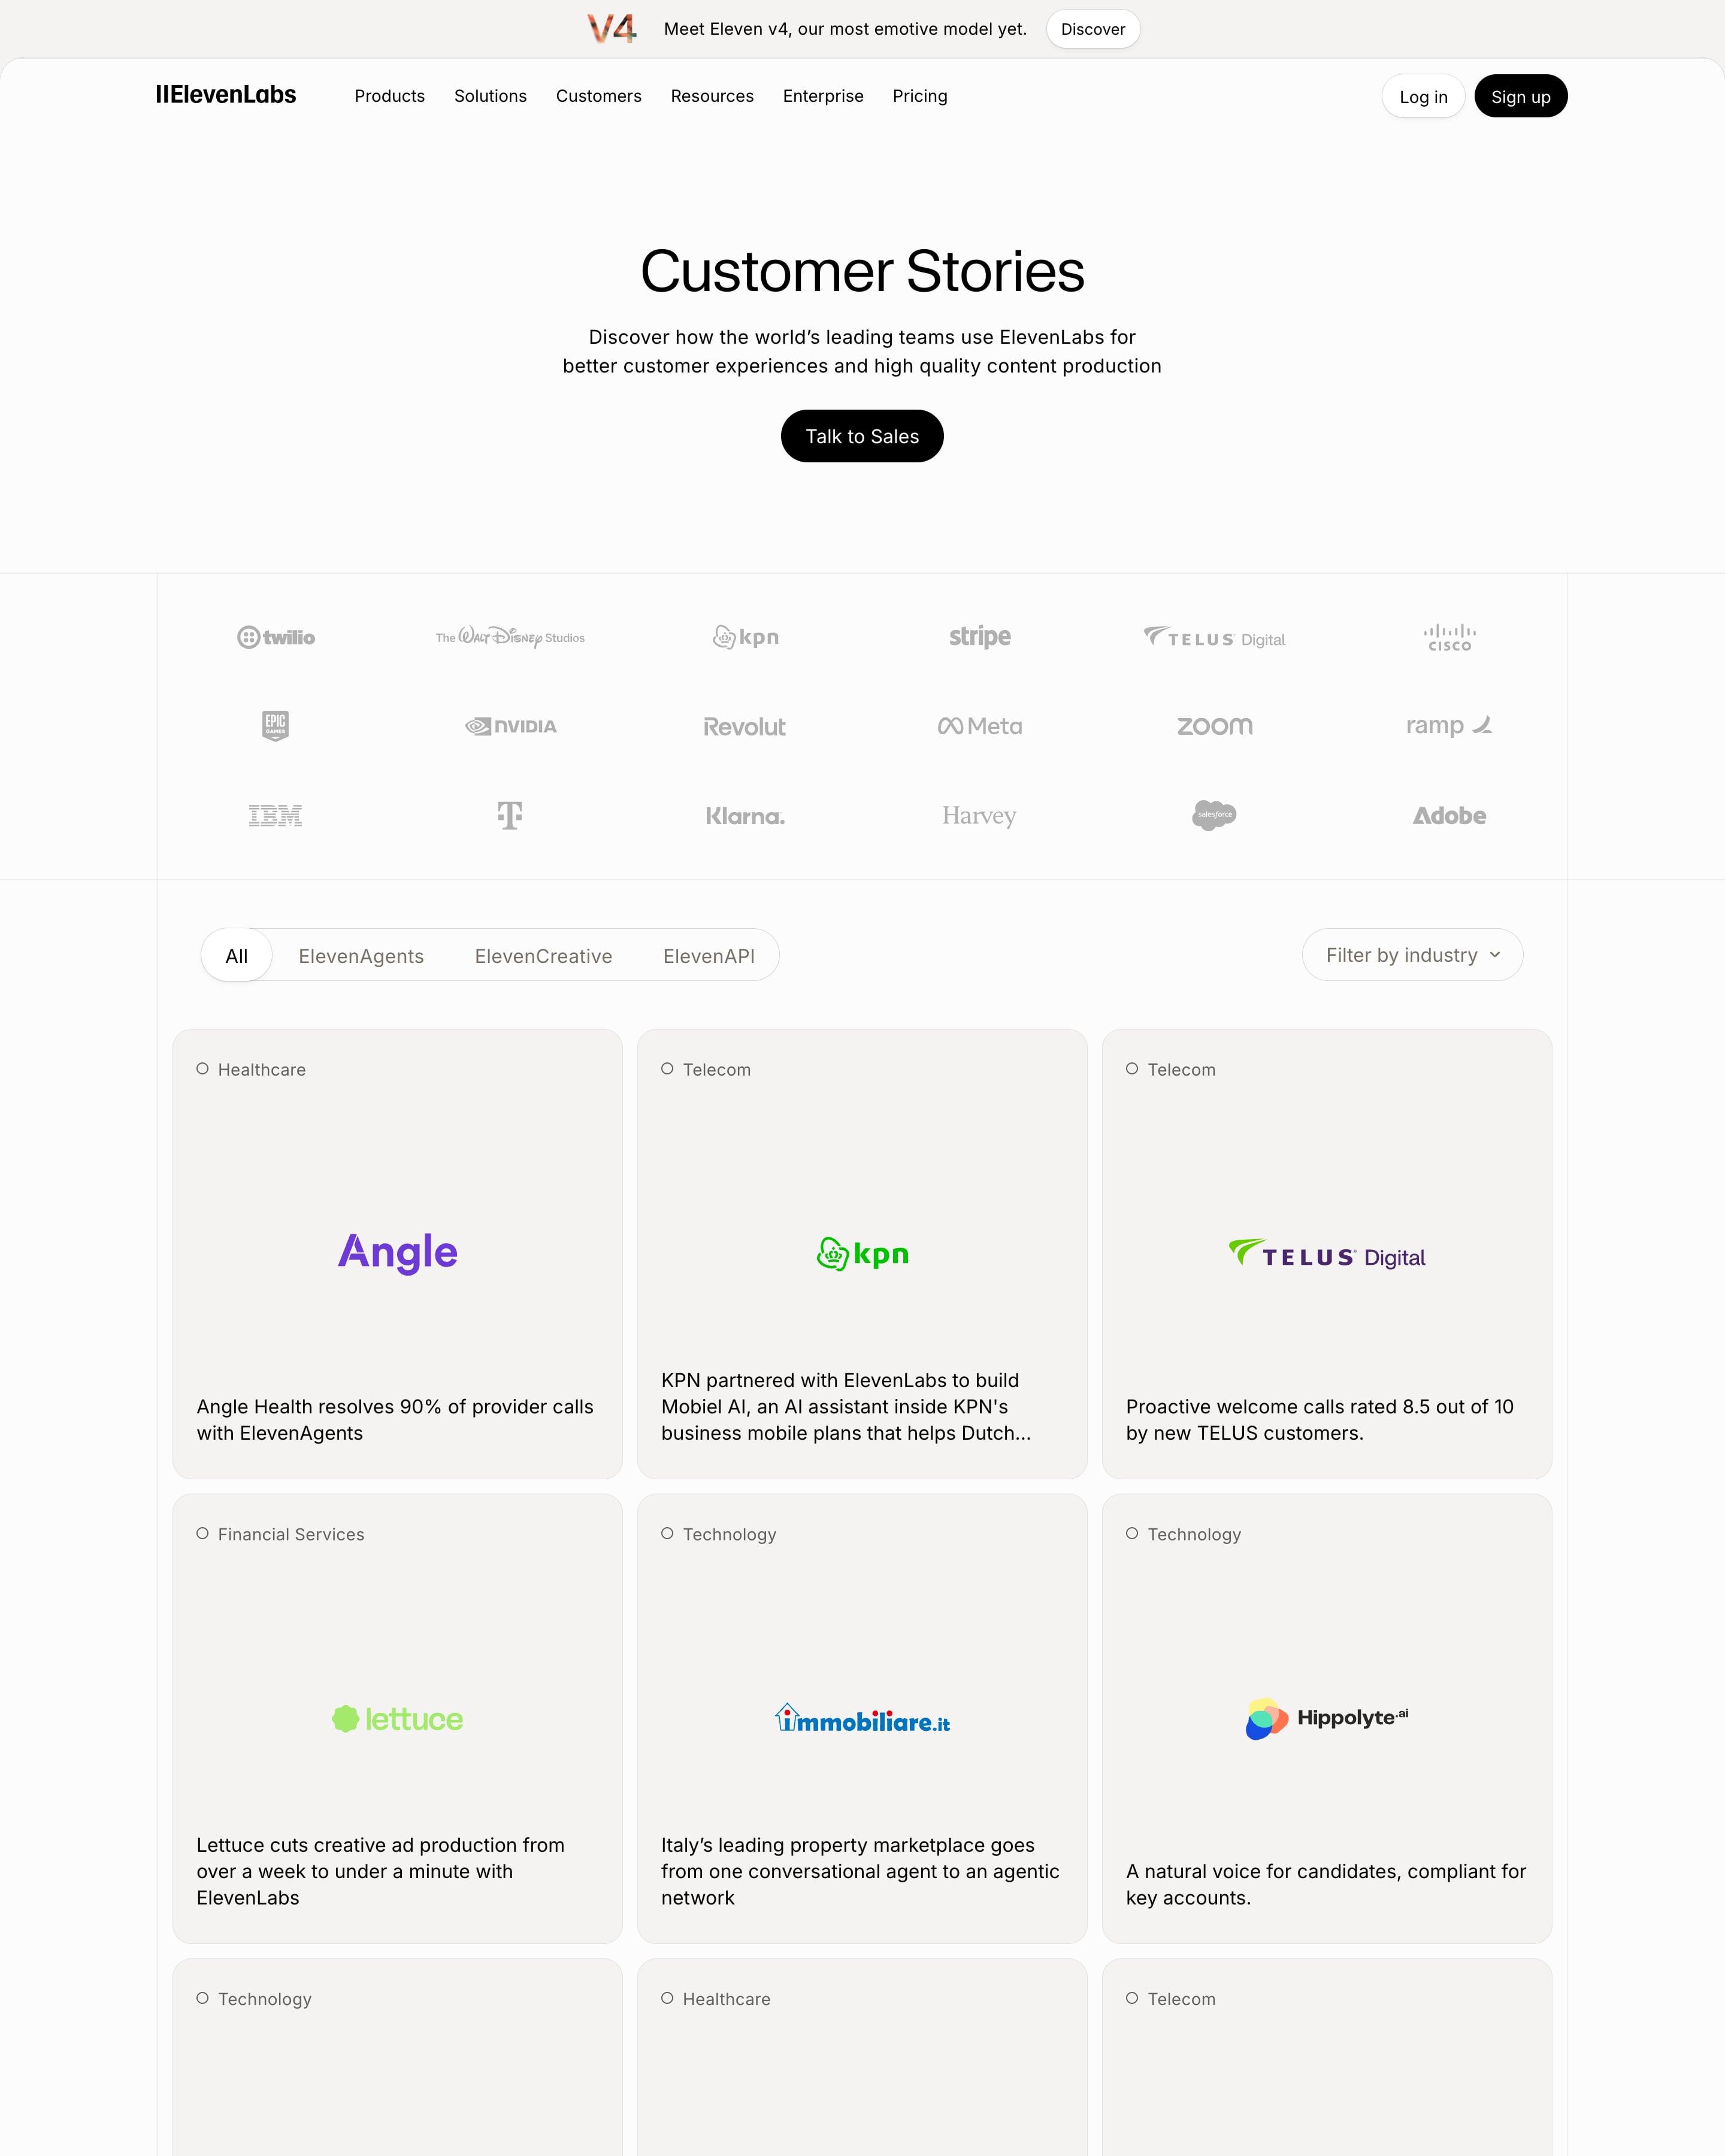
"Customer Stories" opens with a muted logo wall, then tabs for ElevenAgents, ElevenCreative and ElevenAPI plus an industry dropdown. Each story is a beige card with an industry tag, a centred colour logo and a one-line result like "Angle Health resolves 90% of provider calls". "How we run ElevenLabs on ElevenAgents" closes with the company's own use cases.
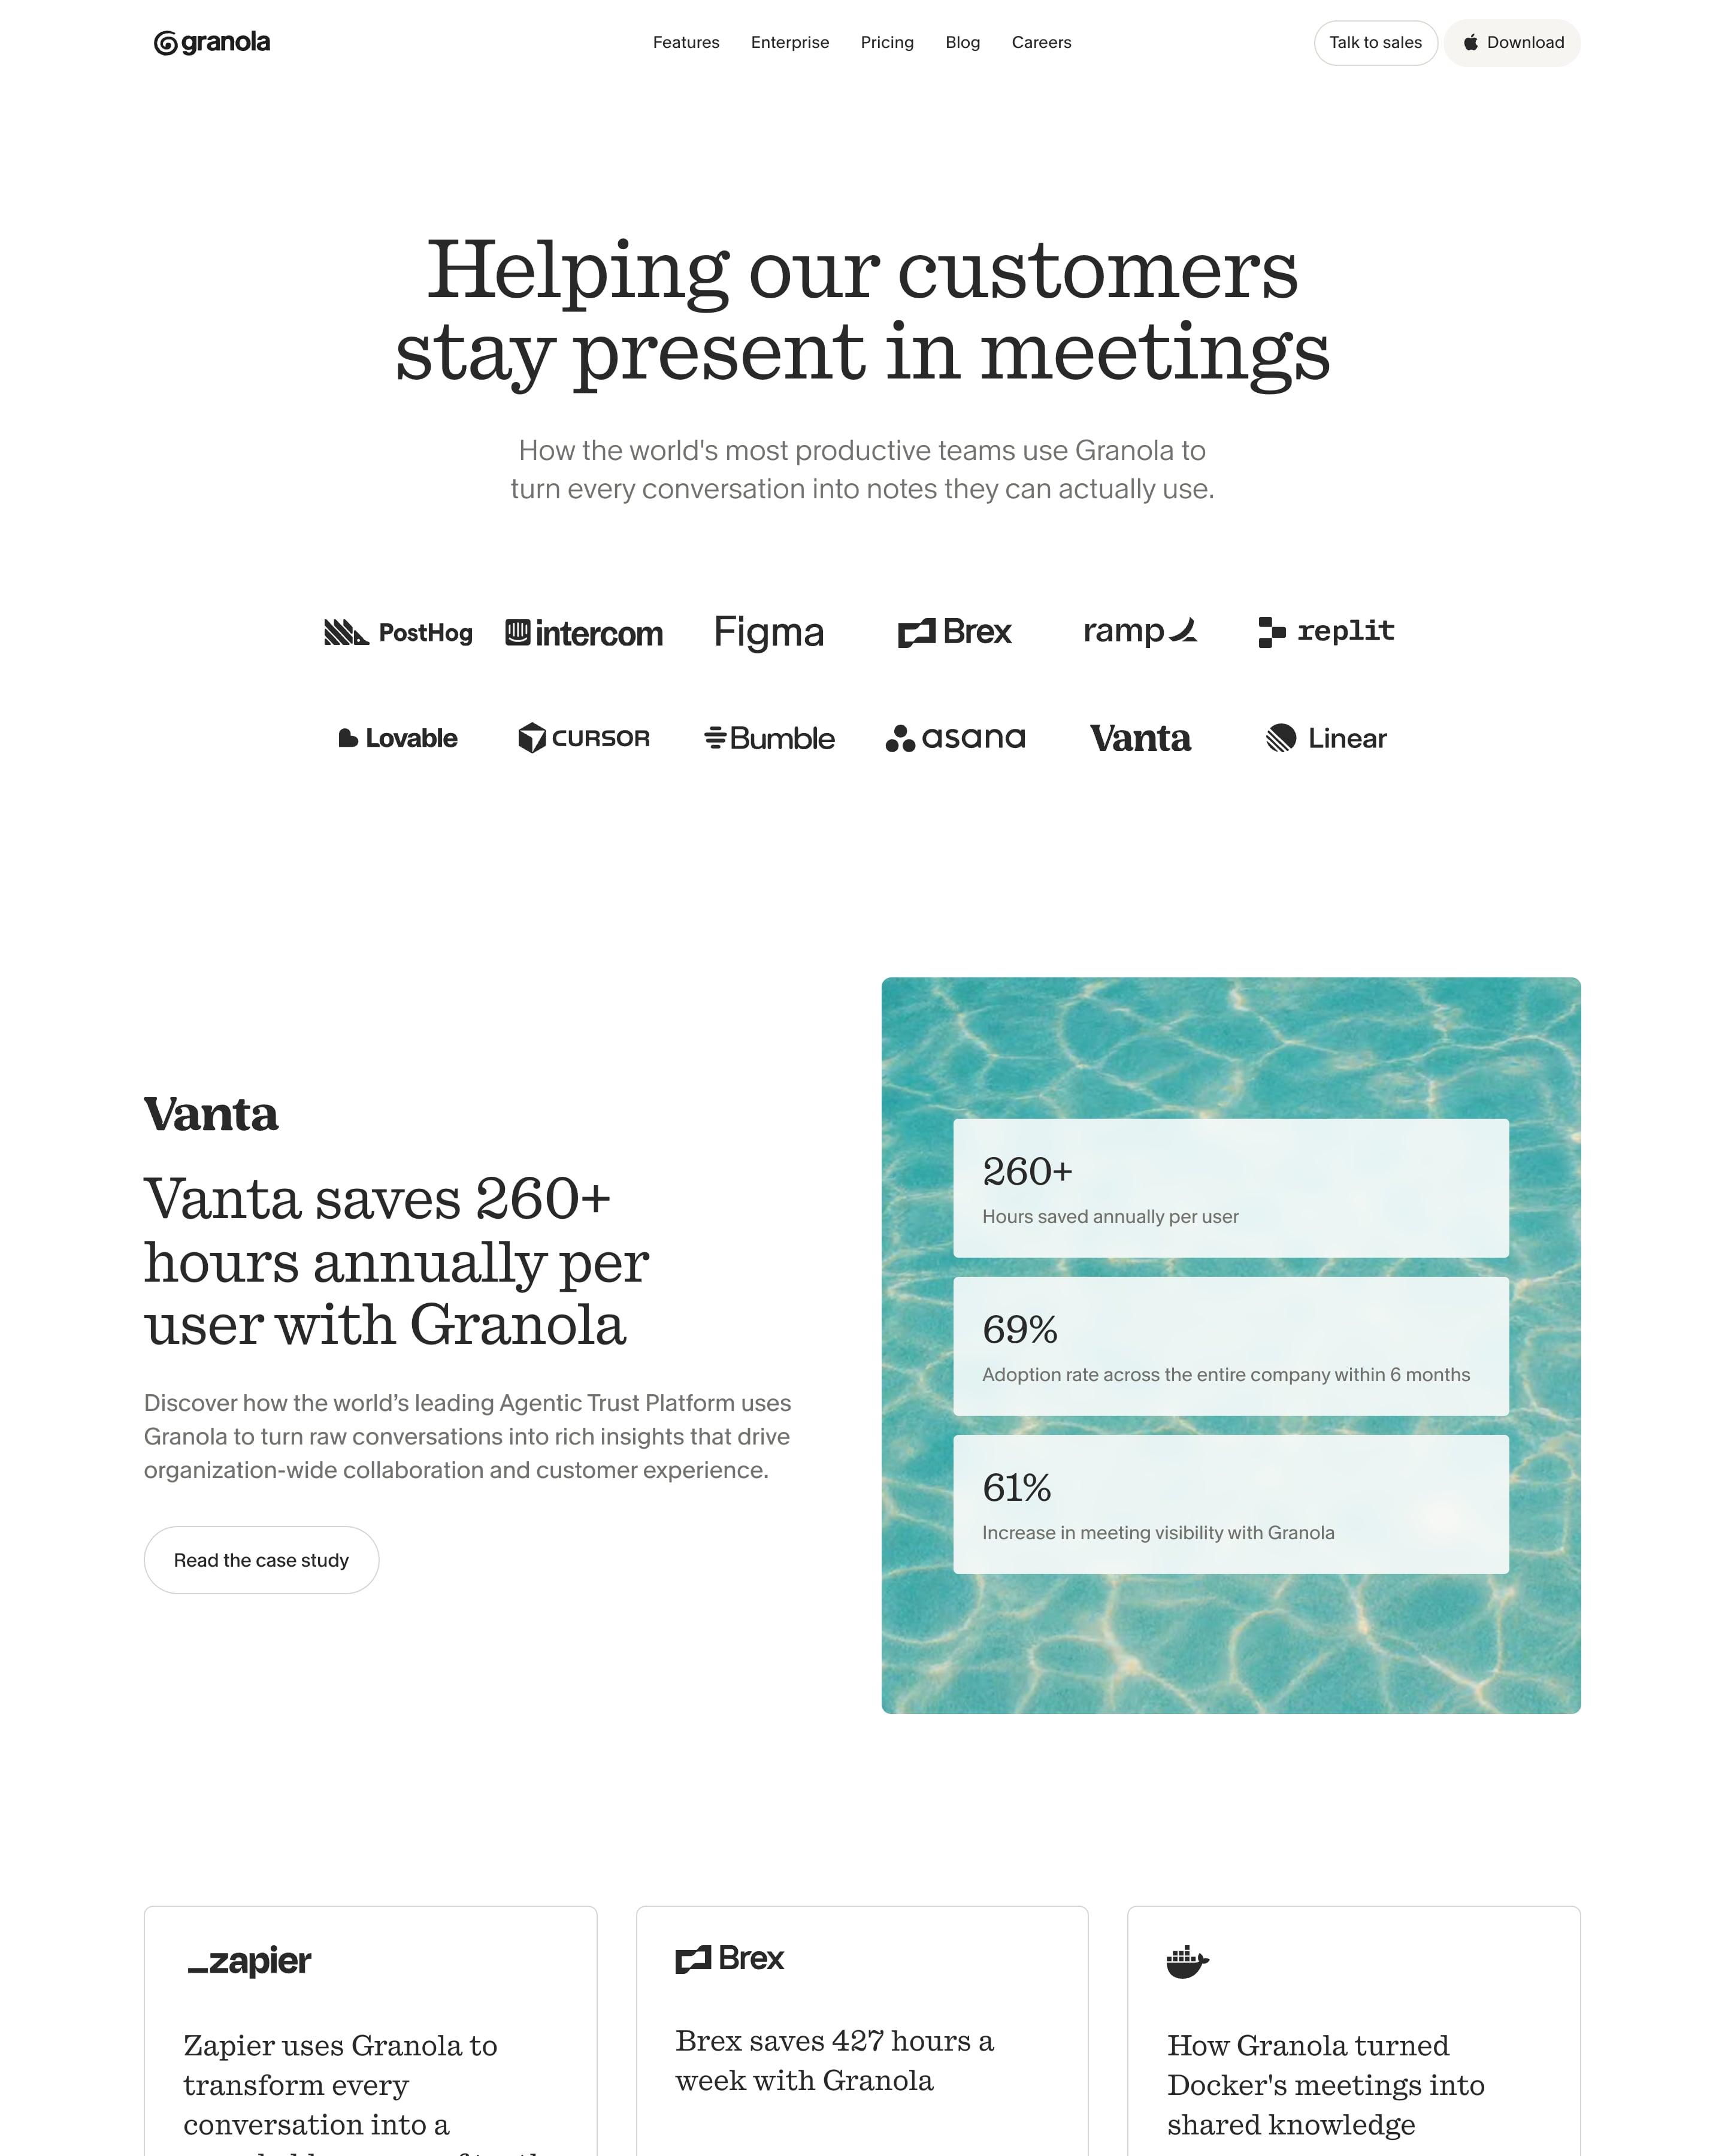
Twelve customer logos sit in two rows under the headline, then a featured Vanta story. Its three frosted stat cards (260+ hours, 69%, 61%), stacked over a photo of pool water, are the idea to take. Zapier, Brex and Docker follow as plain text cards with a case-study button.
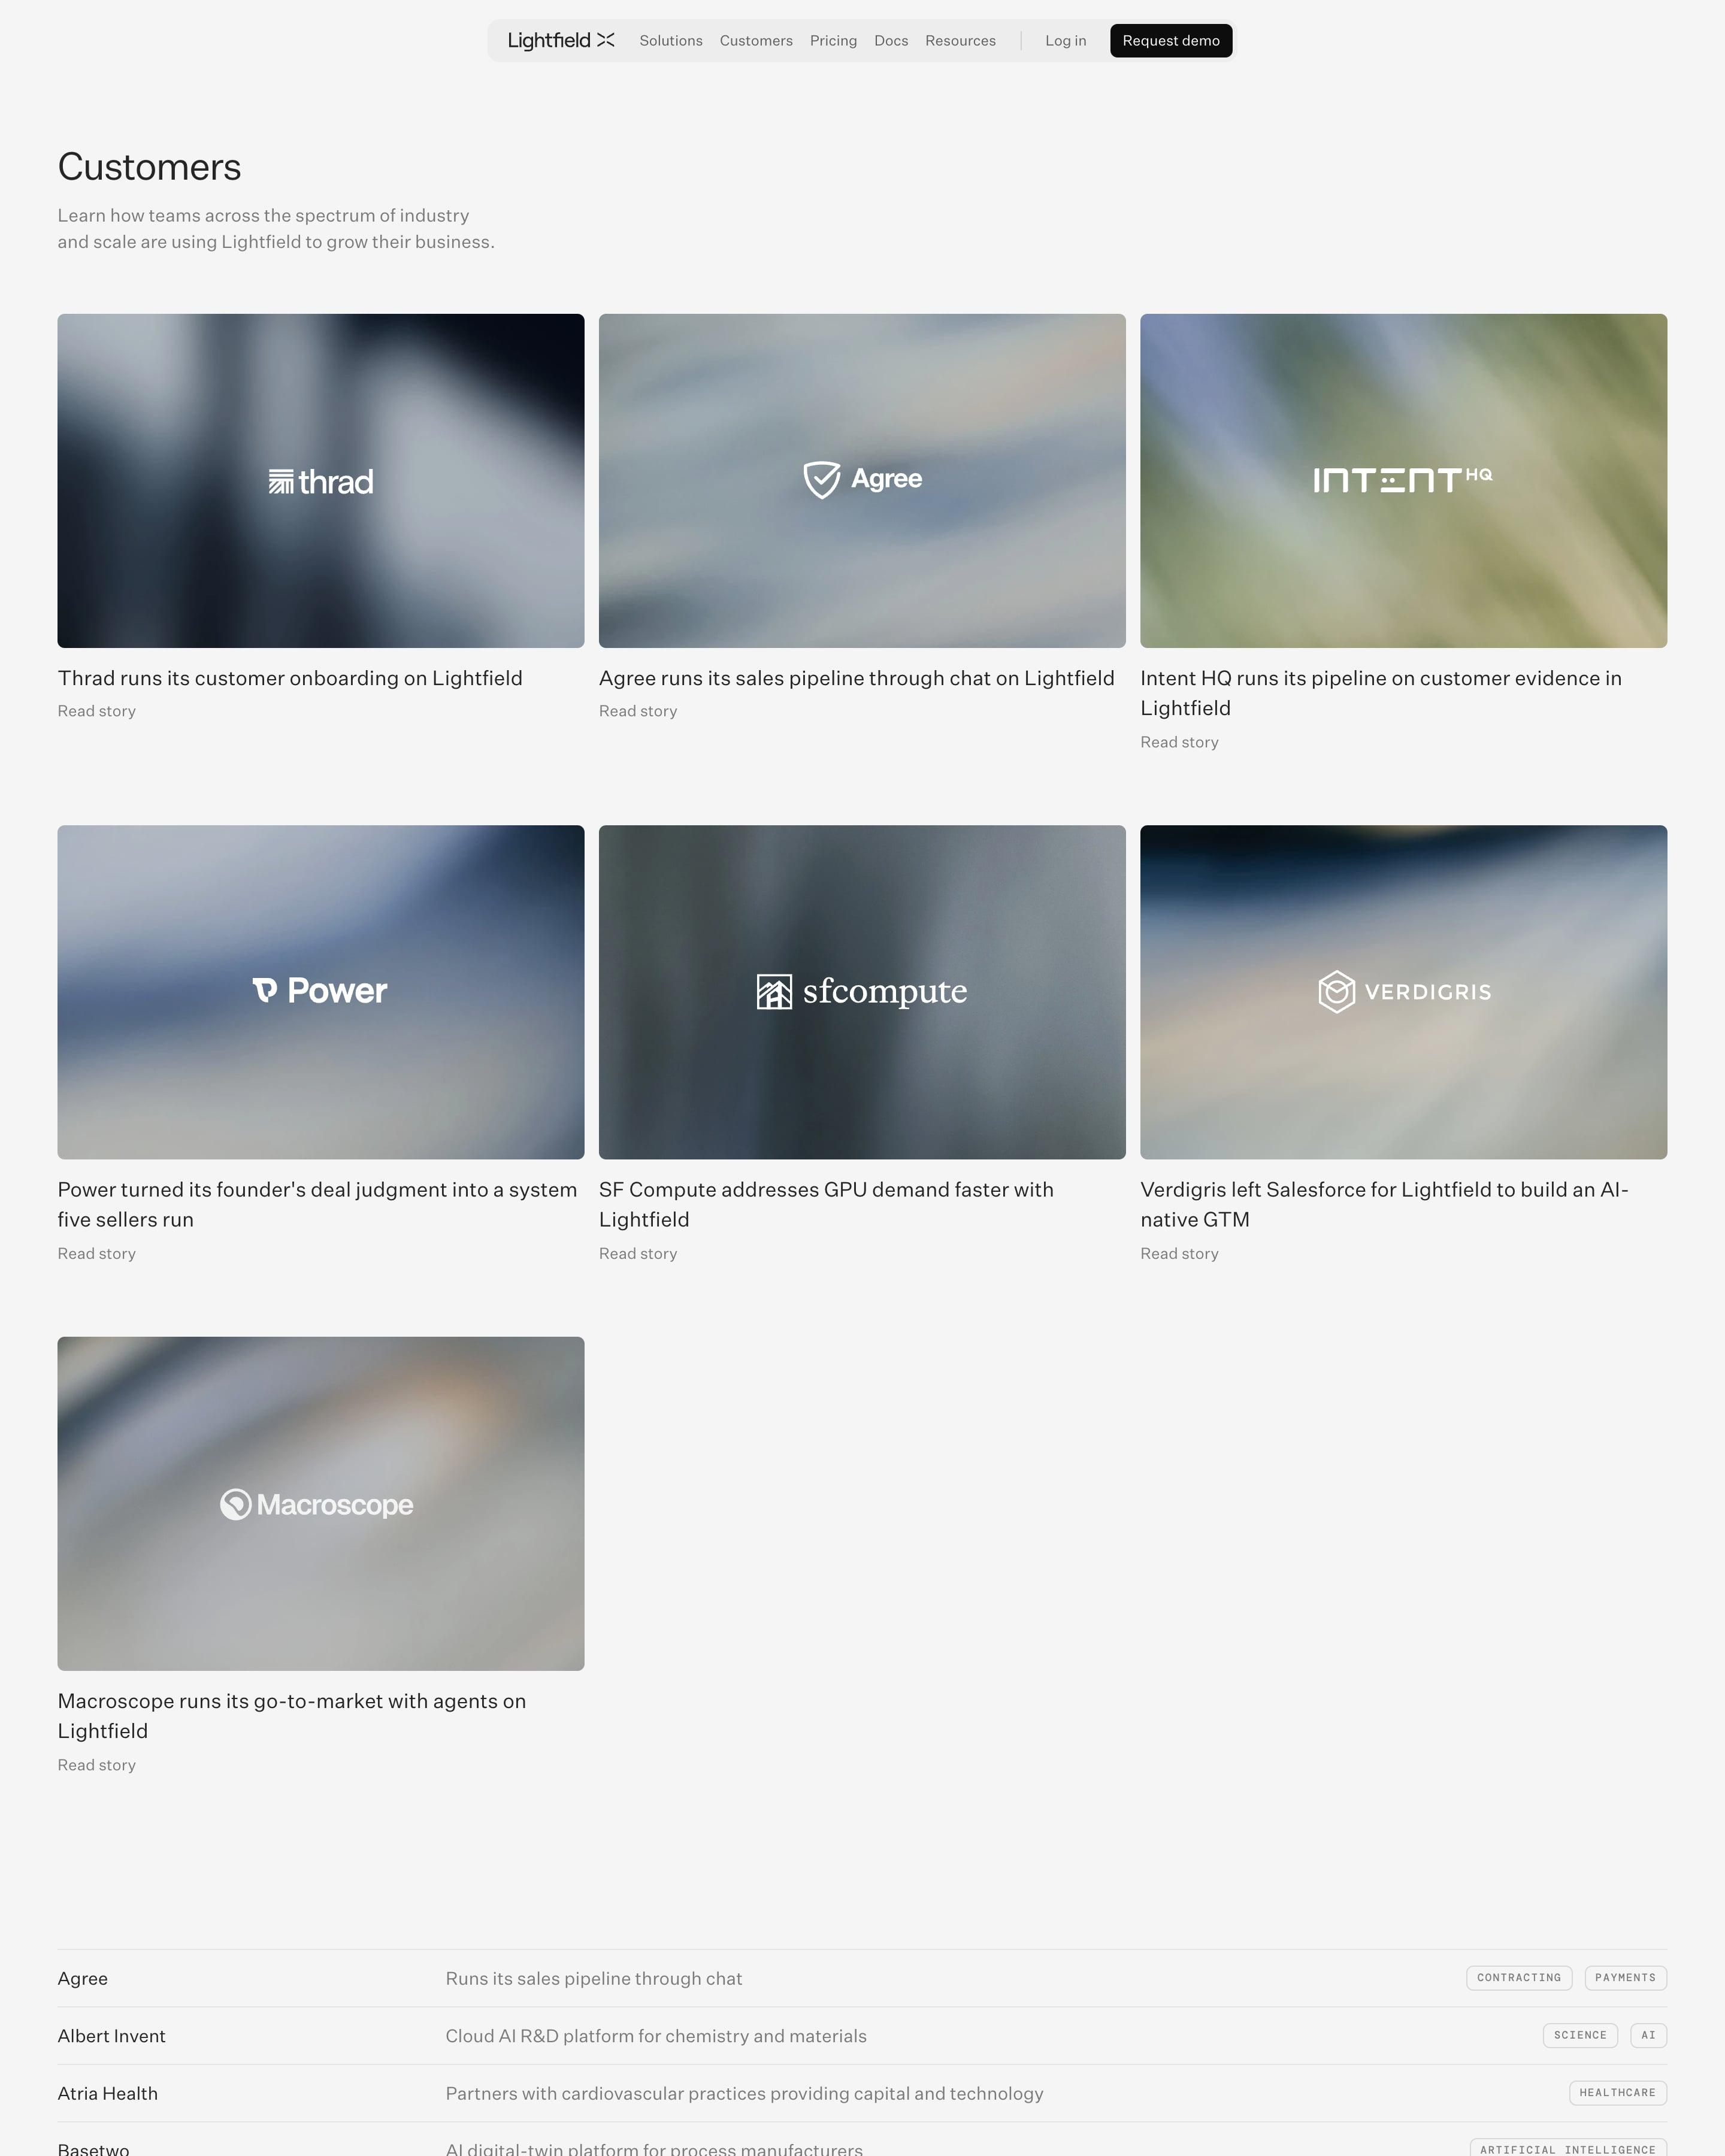
Seven story cards lead, each a blurred photo with the customer's white logo on top and a one-line headline below naming the use case. Underneath, a long directory lists every customer with a one-line description and small tag pills. That table turns a logo wall into something people can scan.
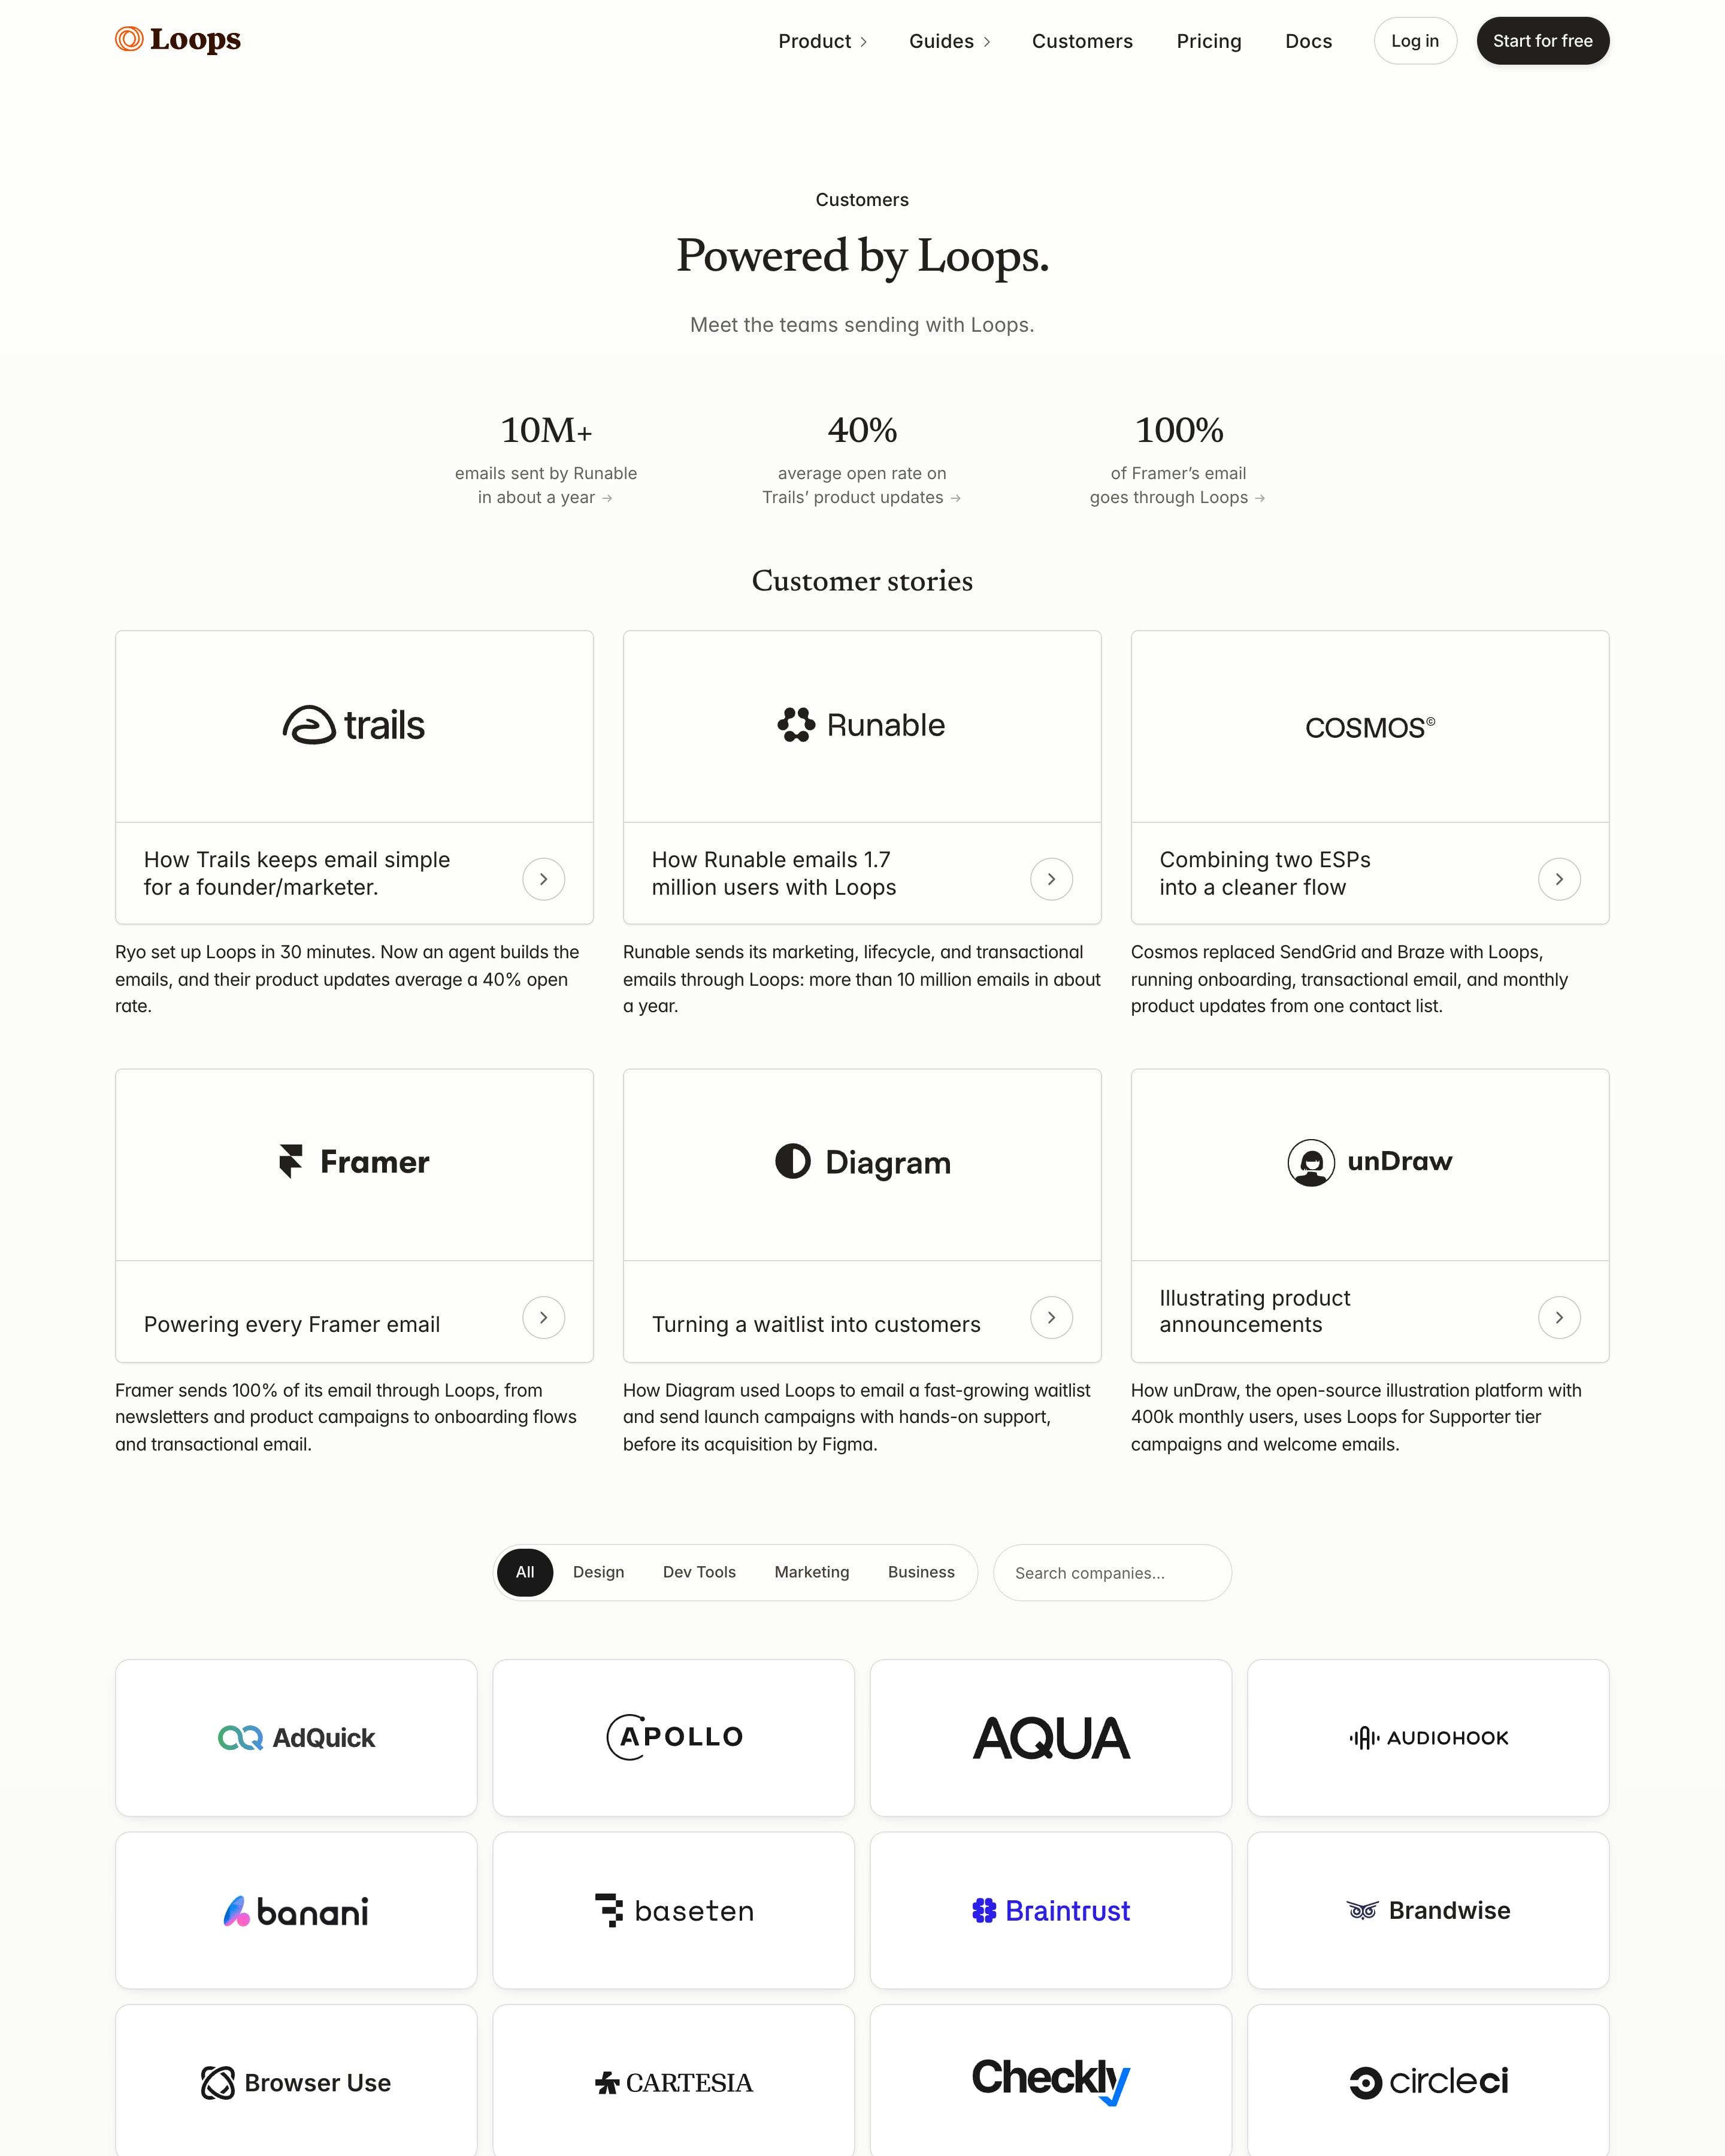
"Powered by Loops." opens with three stats (10M+, 40%, 100%) that each link to a story. Six story cards follow, each a big logo above a one-line headline, with a short summary set outside the card. Then comes a filterable wall of logo tiles in four columns, with Design, Dev Tools, Marketing and Business pills plus a company search.
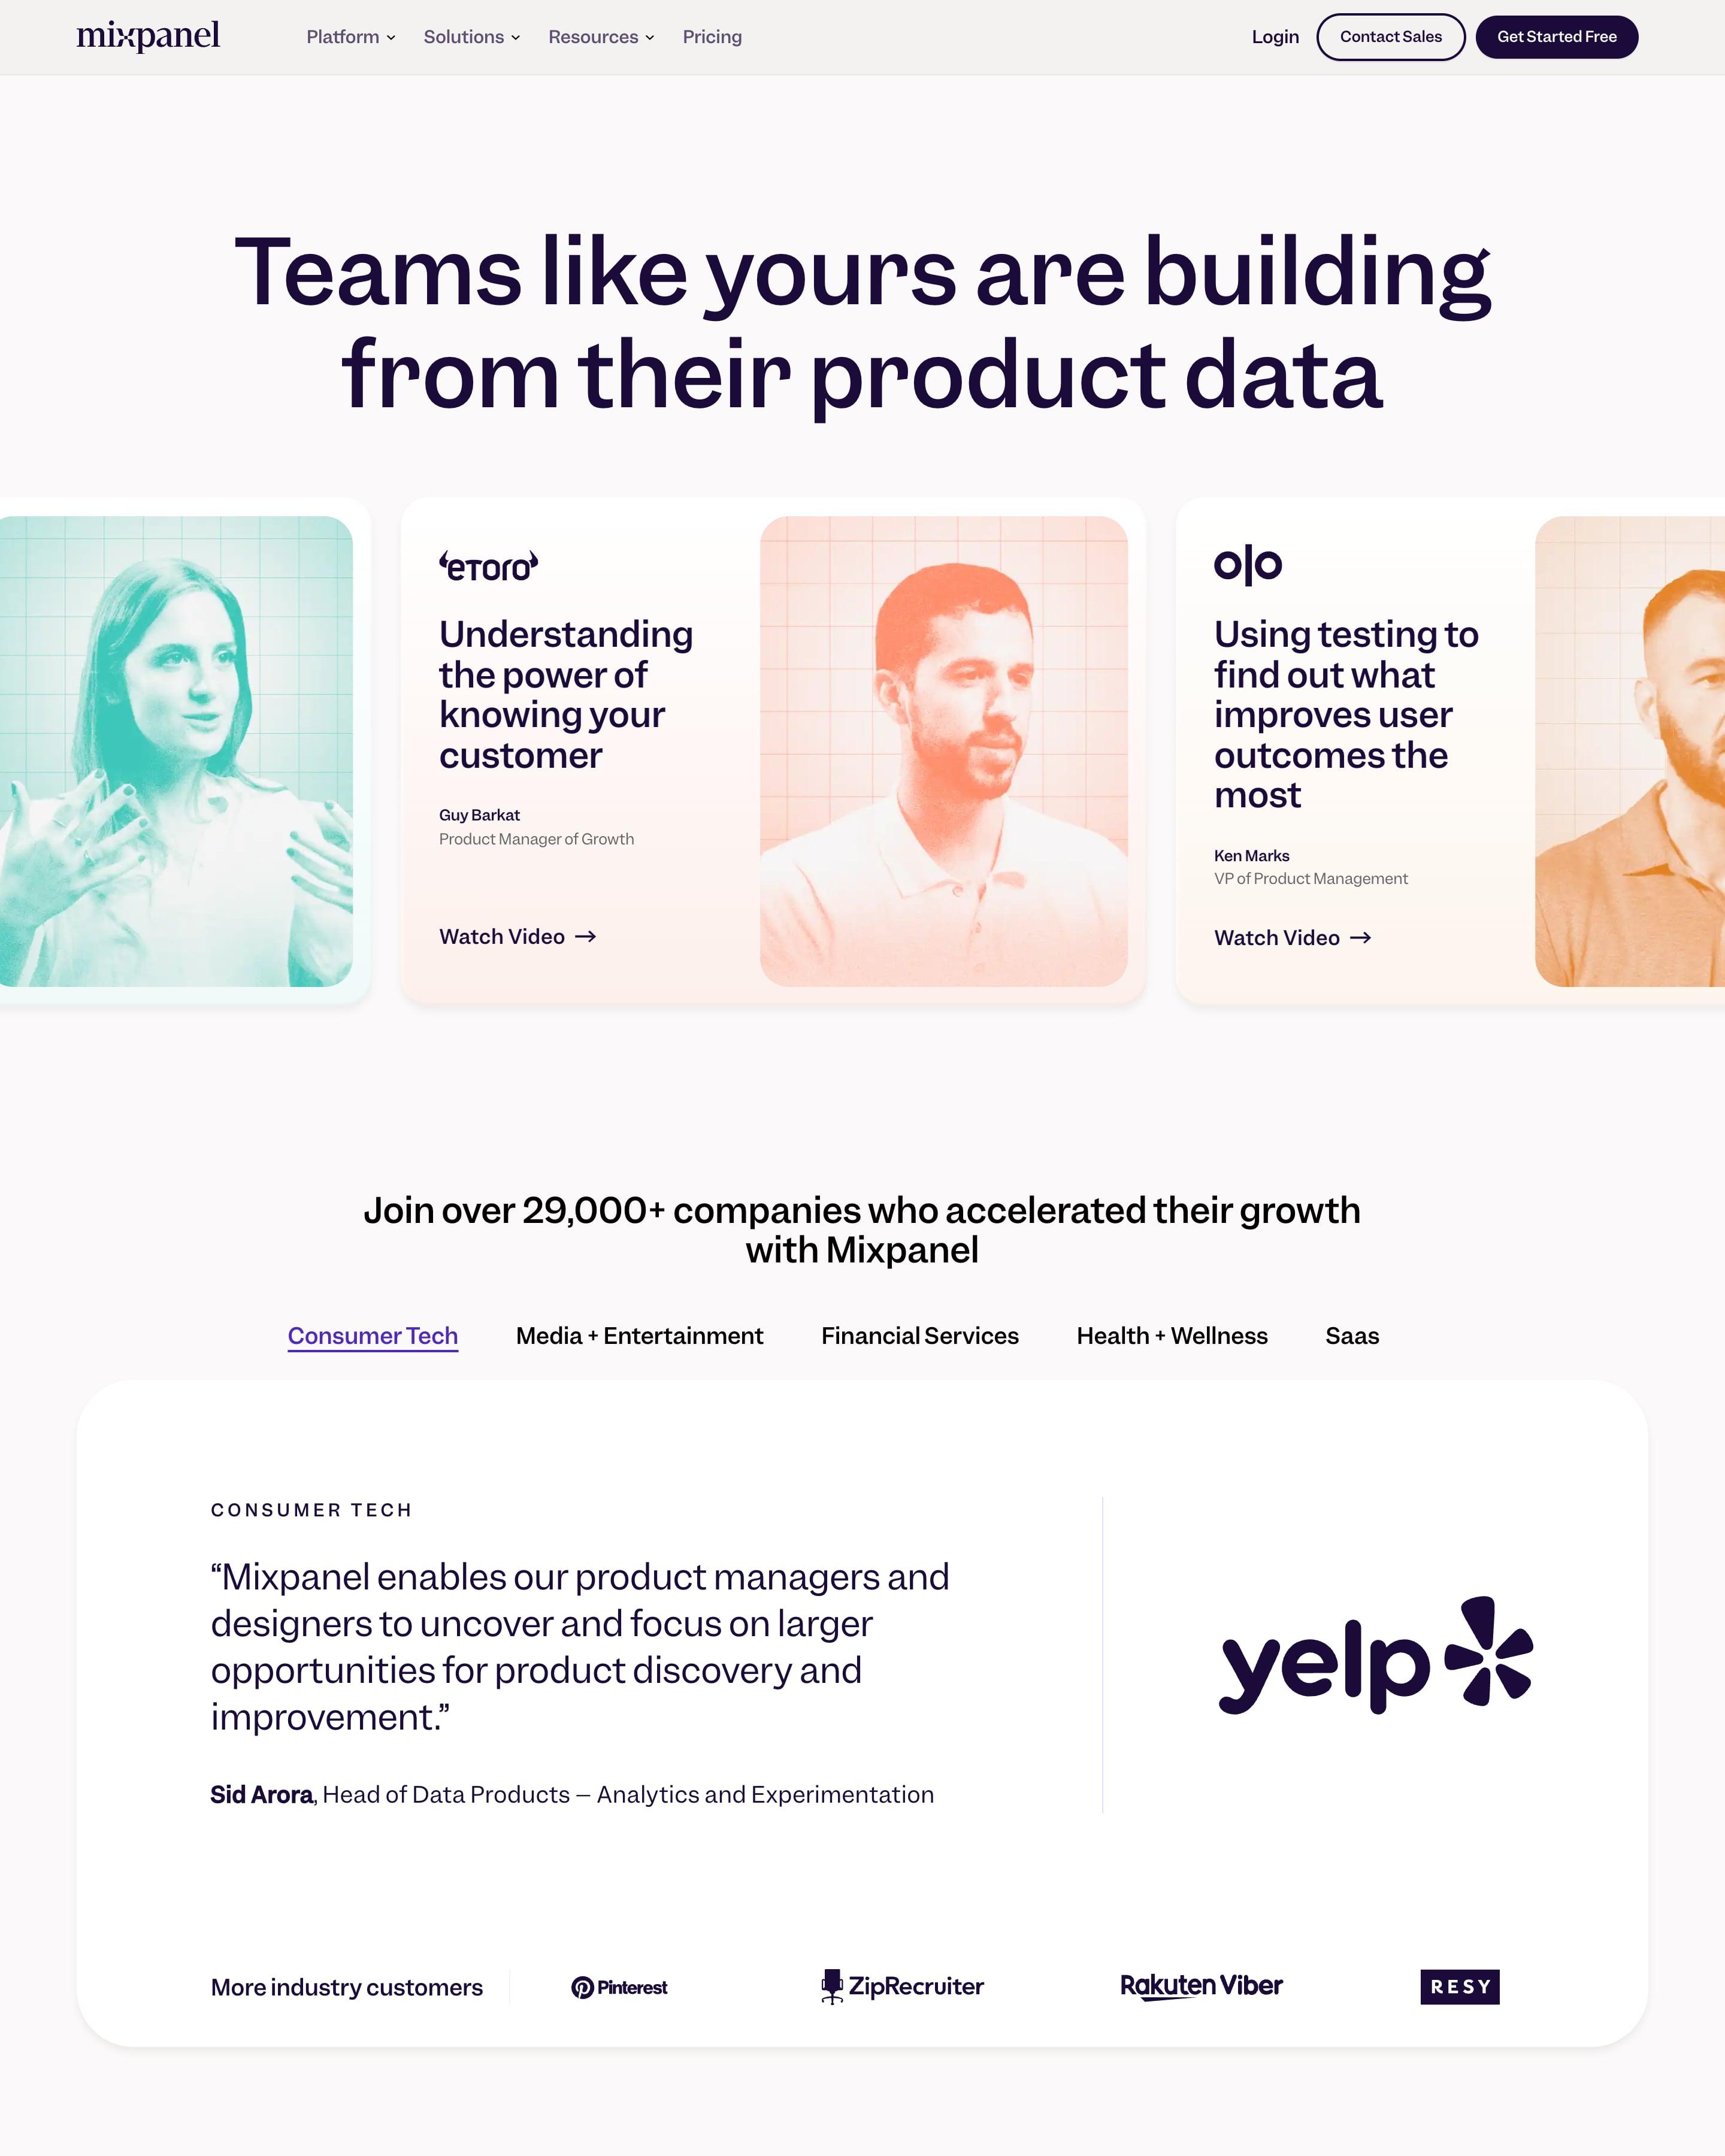
Video stories open the page in a sideways carousel, each card pairing a headline with a duotone portrait in mint, coral or peach. Industry tabs sit over a featured quote and a logo row, ahead of three large stats and six story cards tagged by sector. Those tinted portraits are what to steal.
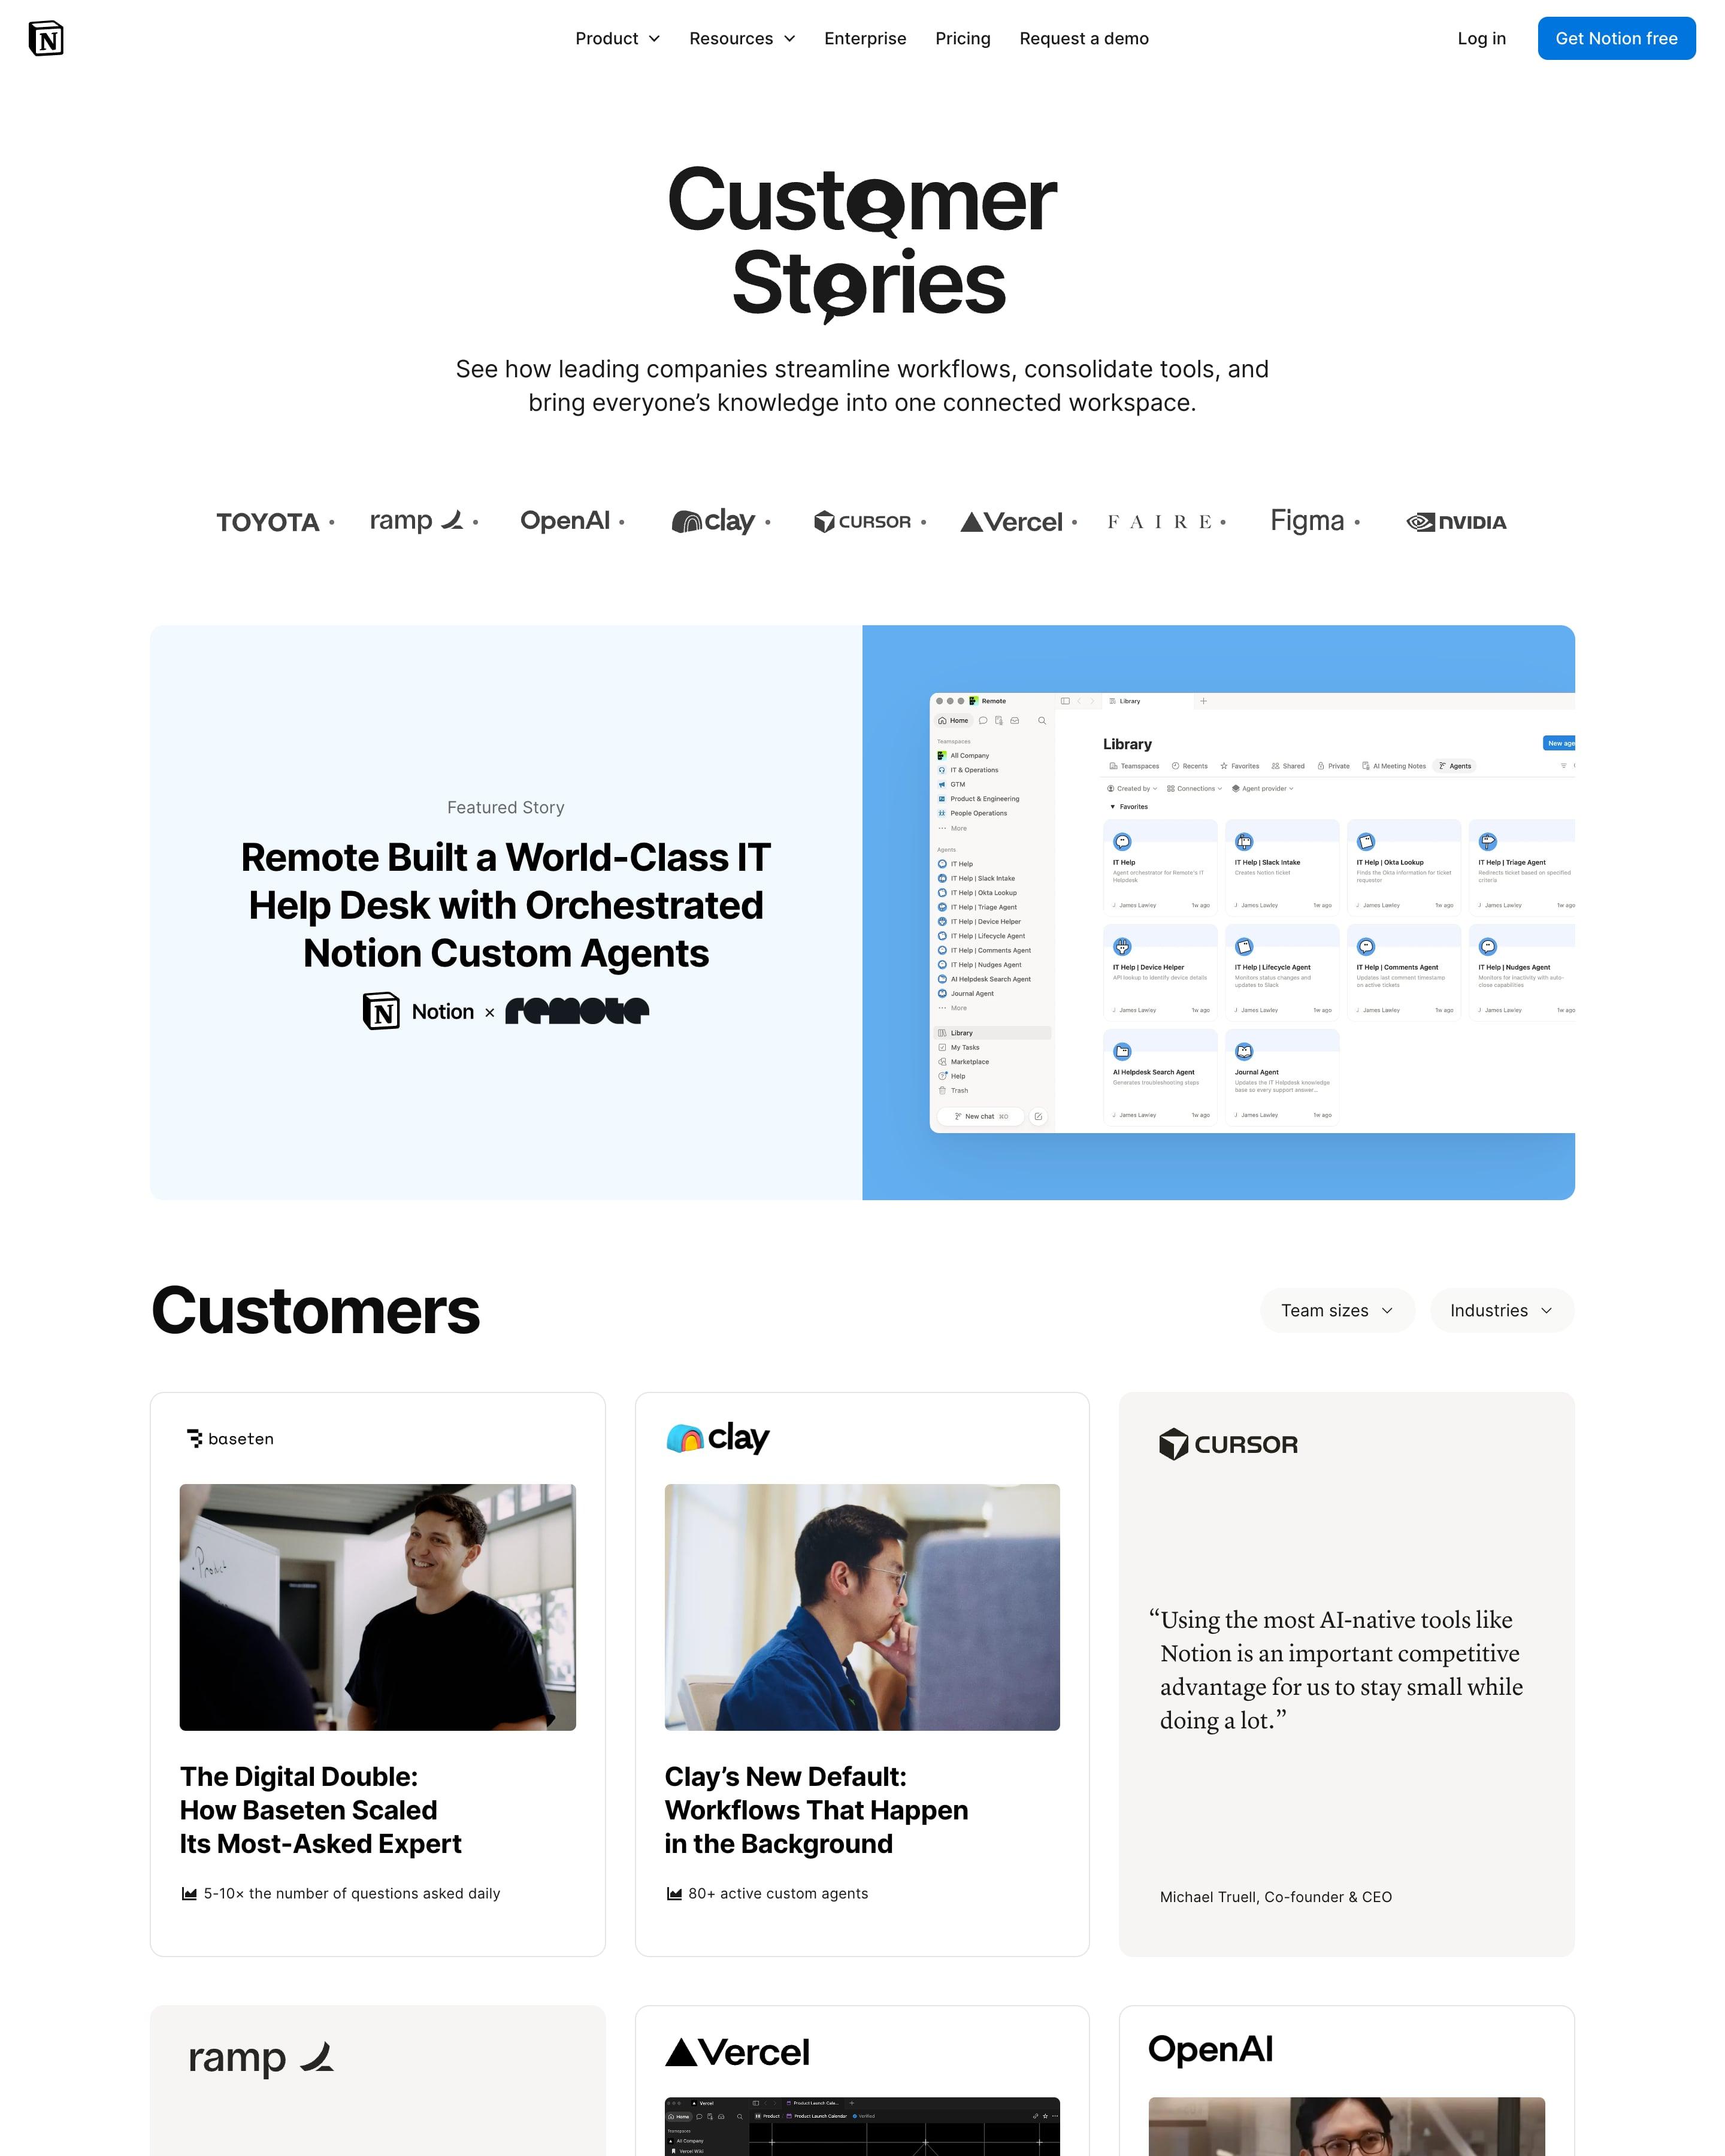
"Customer Stories" swaps the o's for speech-bubble glyphs in the headline, above a logo row and a pale blue featured story about Remote. The grid mixes three card types: photo with headline, a quote card, and big-number cards like Ramp's 70% and 3 min. Every card carries one metric with a small chart icon at the bottom.
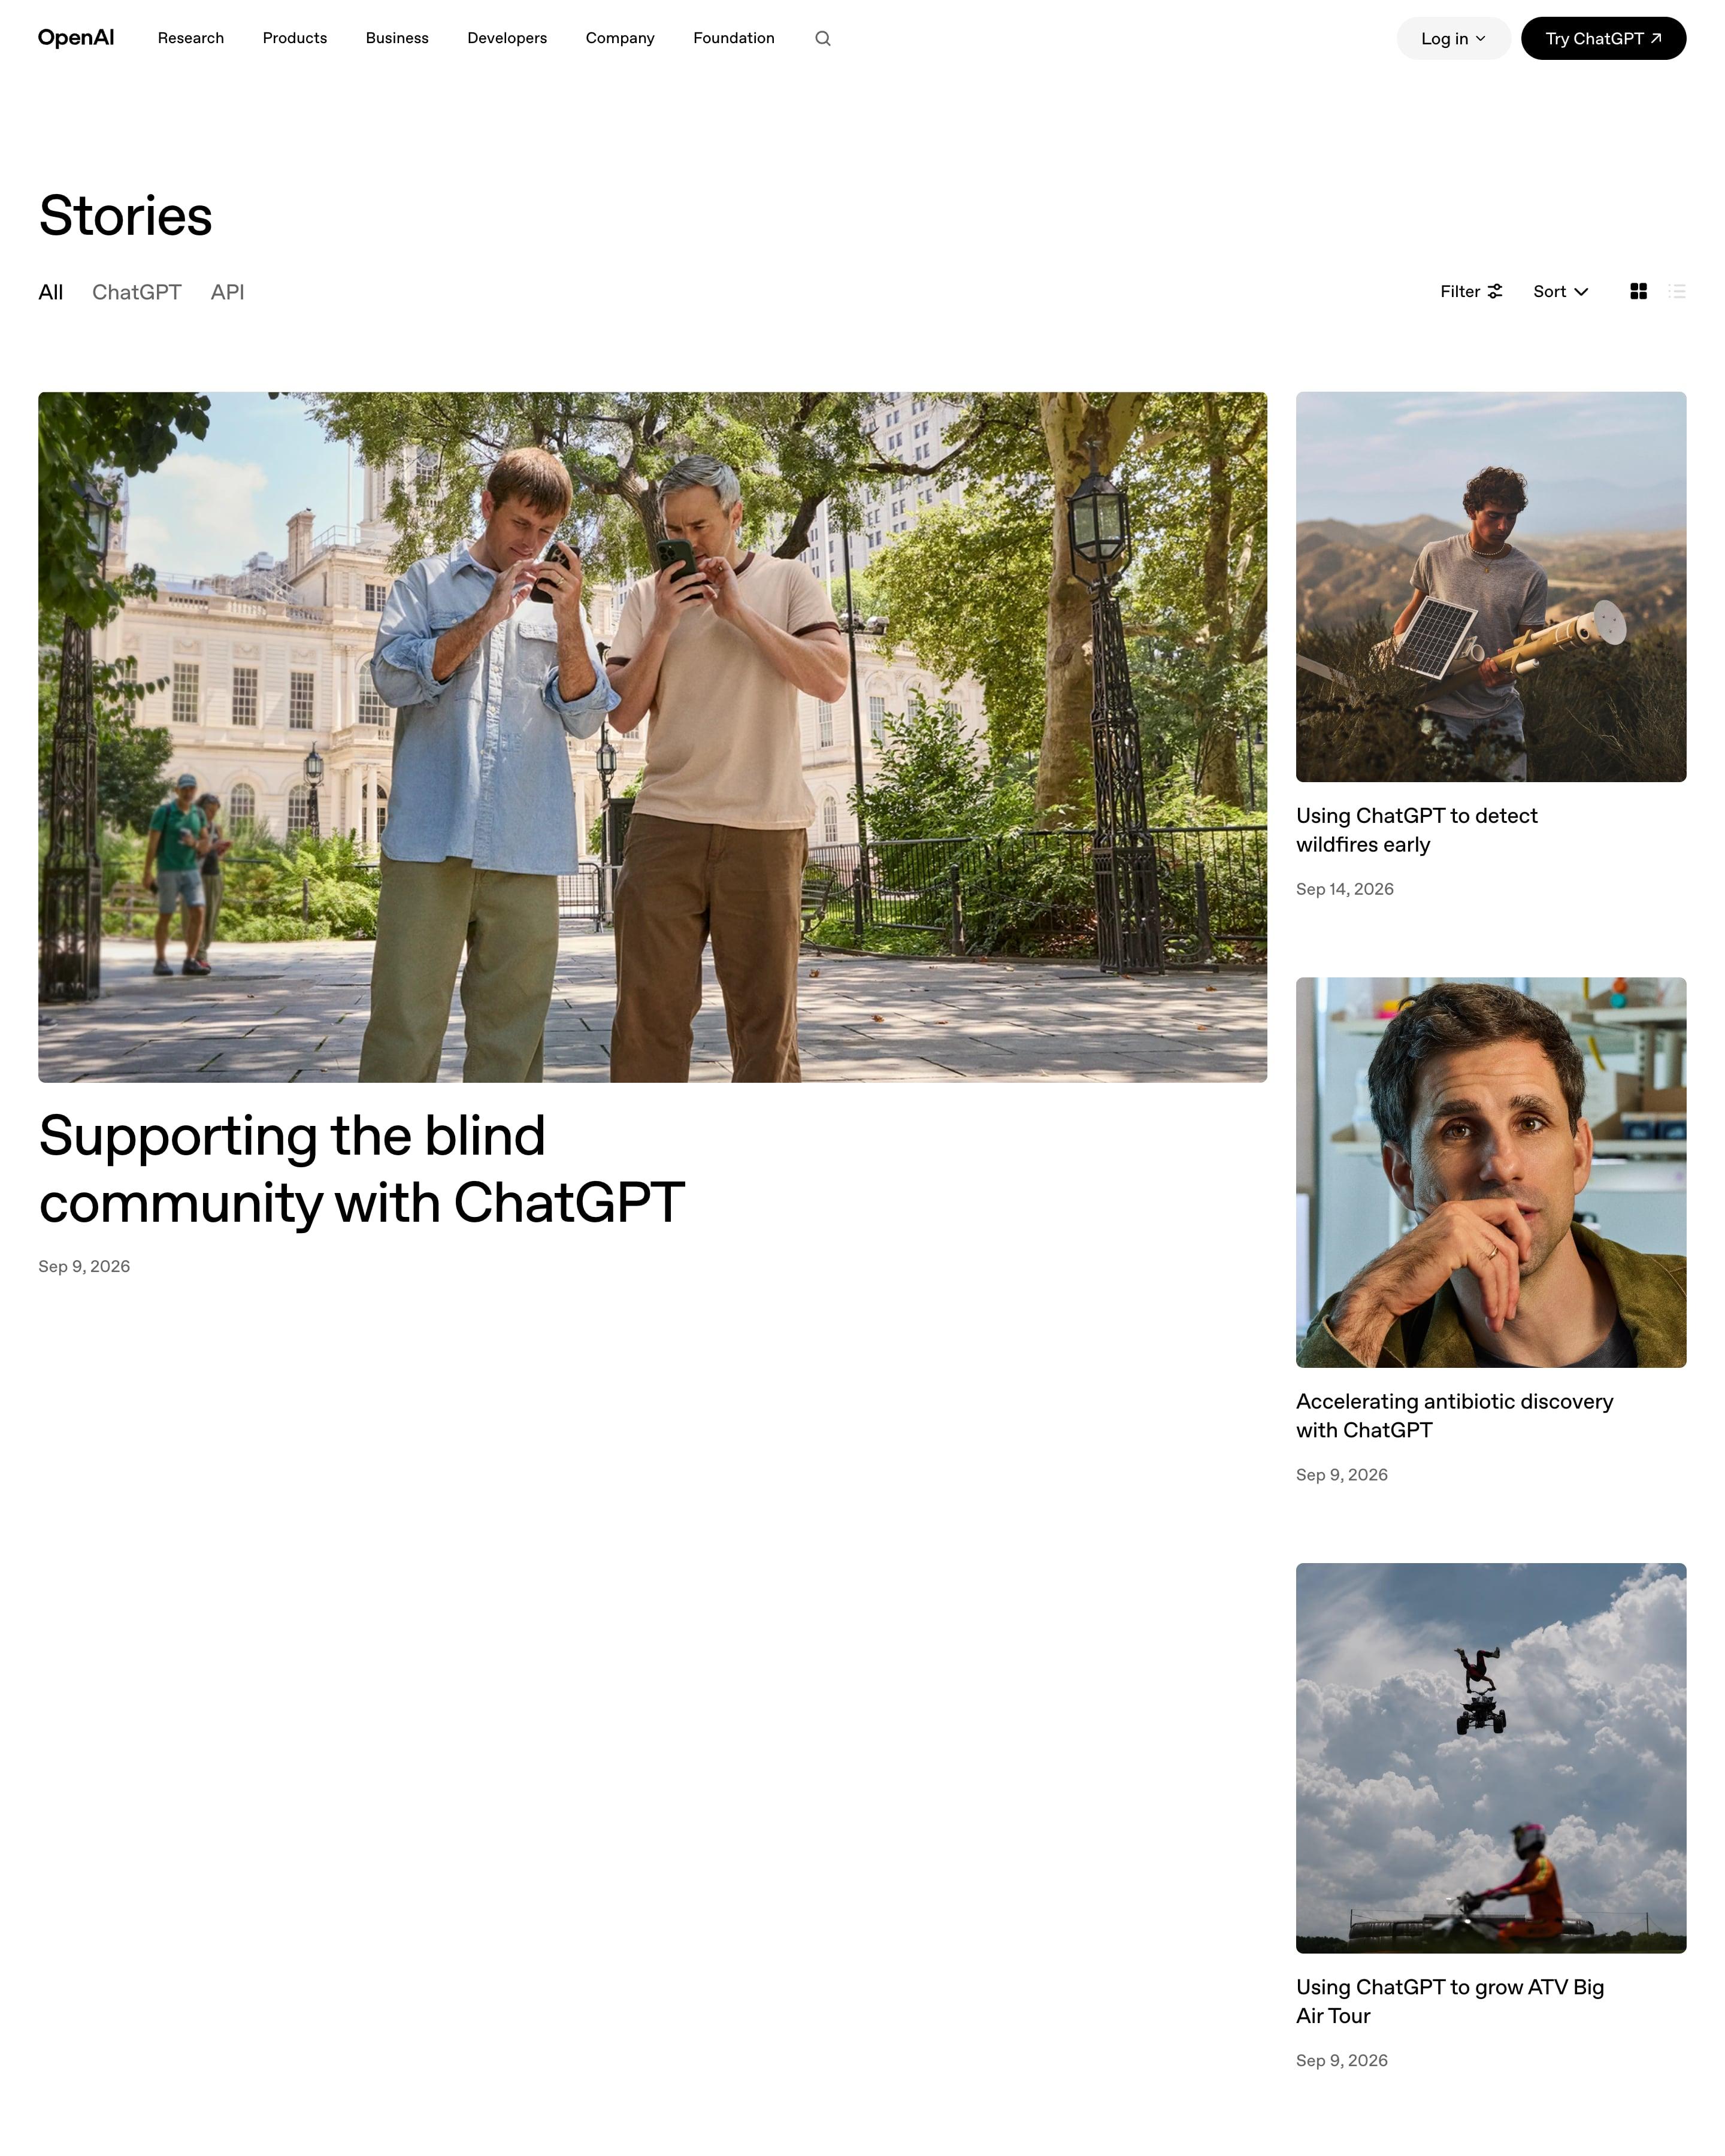
"Stories" opens with All, ChatGPT and API tabs plus Filter, Sort and a grid/list switch. A large lead story, "Supporting the blind community with ChatGPT", sits beside three stacked smaller ones, then a four-column grid of documentary photos with short titles, a product tag and a date. Worth copying: real photography of people instead of logos, with almost no copy on the cards.
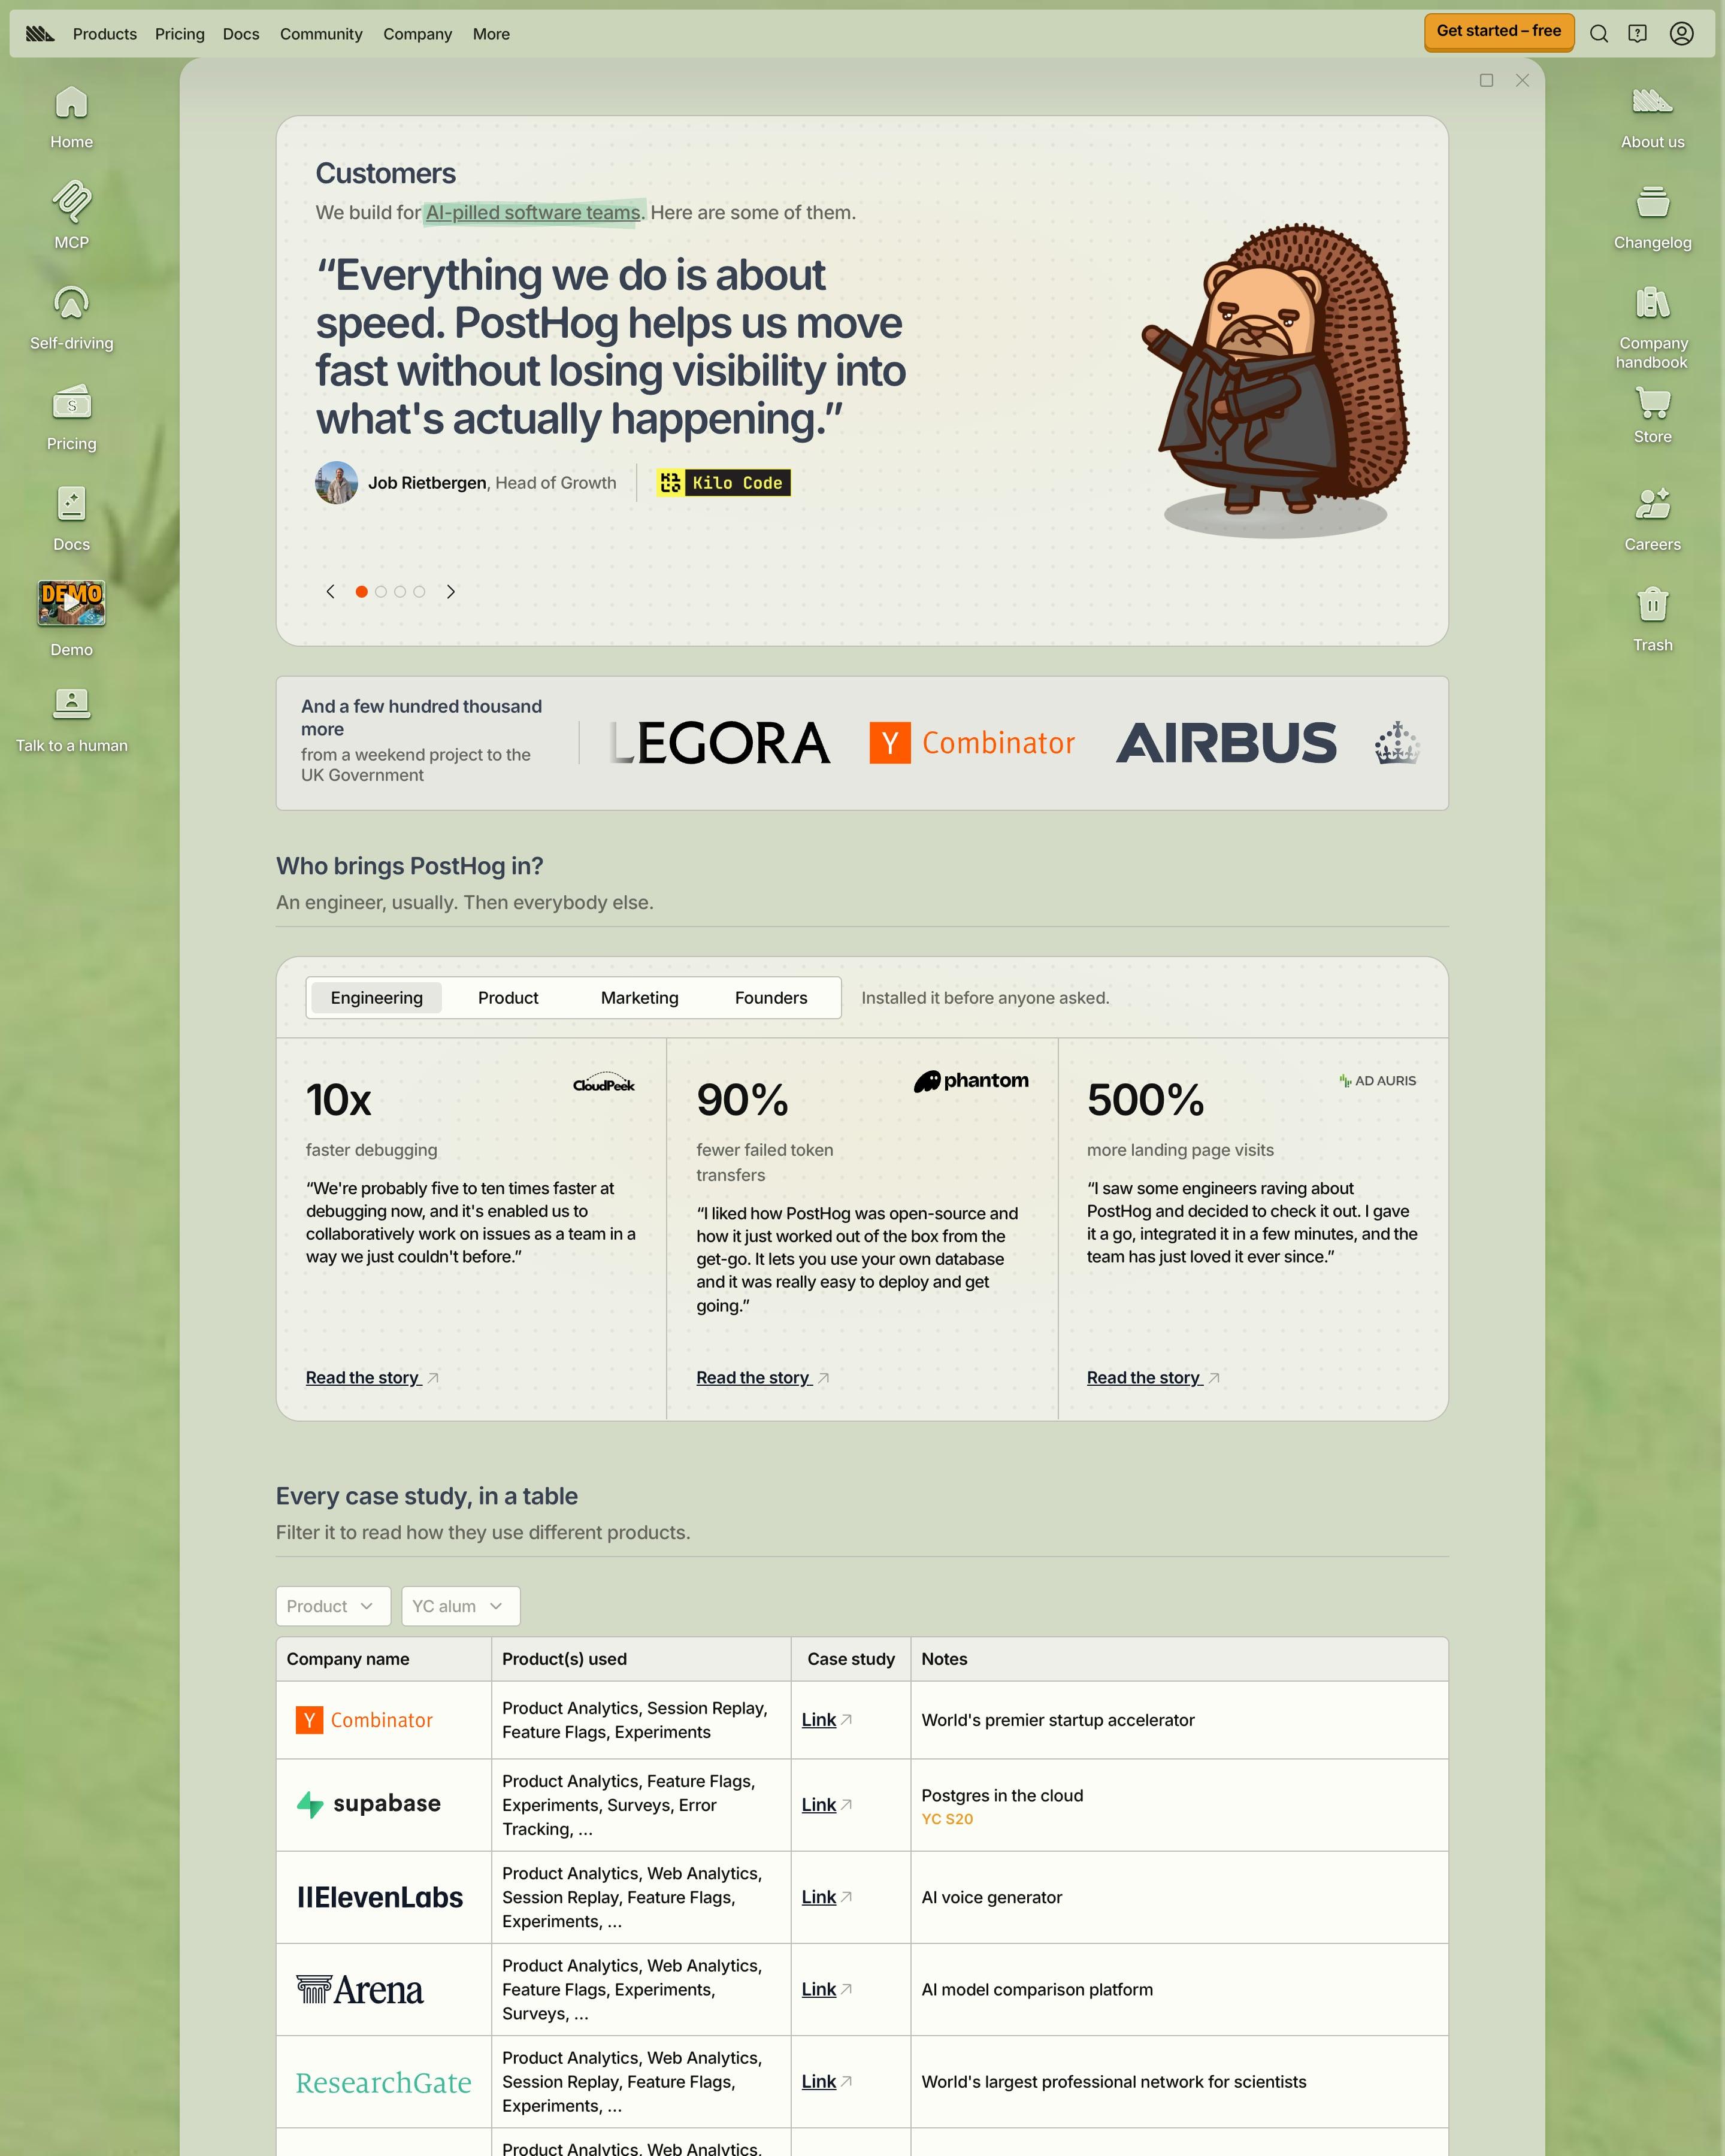
A carousel of customer quotes opens beside a hedgehog in a suit. Tabs then sort stories by who brought the tool in, from engineering to founders, each with big numbers. Steal "Every case study, in a table", which lists company, products used, a link and a one-line note.
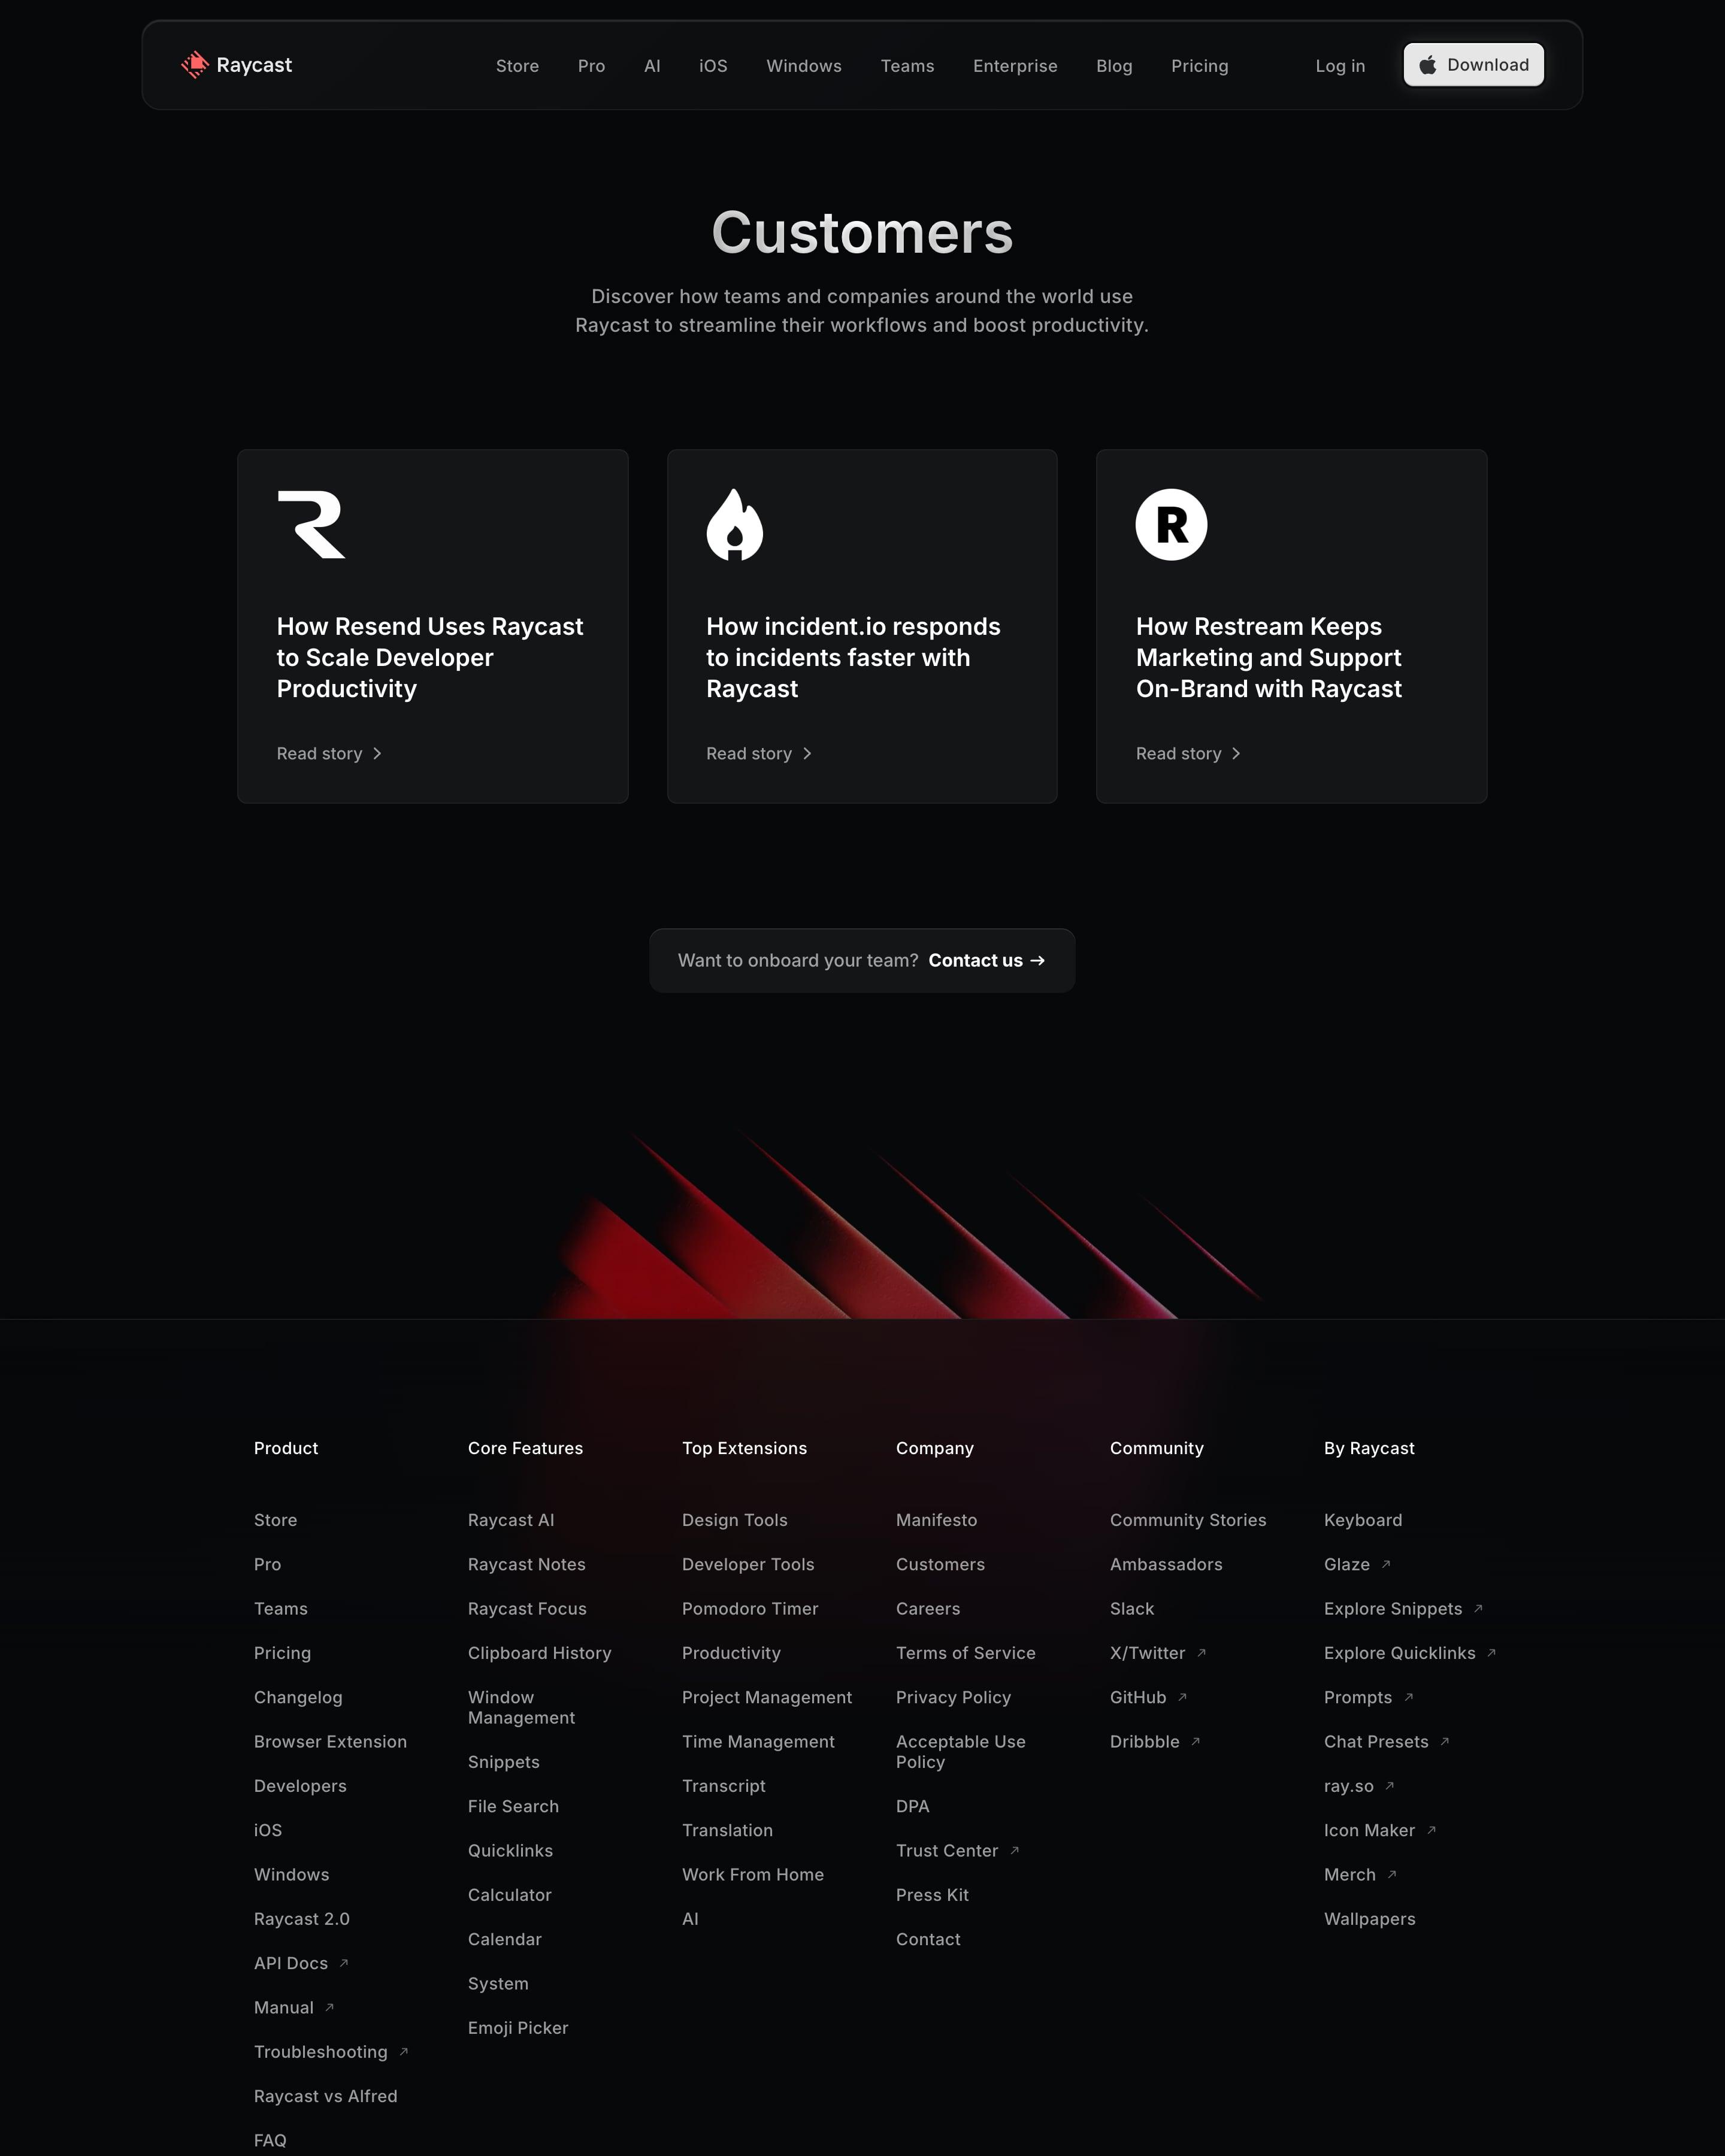
Just three stories fill this page, each a dark card with the customer's white logo mark, a 'How …' headline and a Read story link. A small pill below asks 'Want to onboard your team? Contact us', a low-key sales prompt worth copying when there are only a few stories.
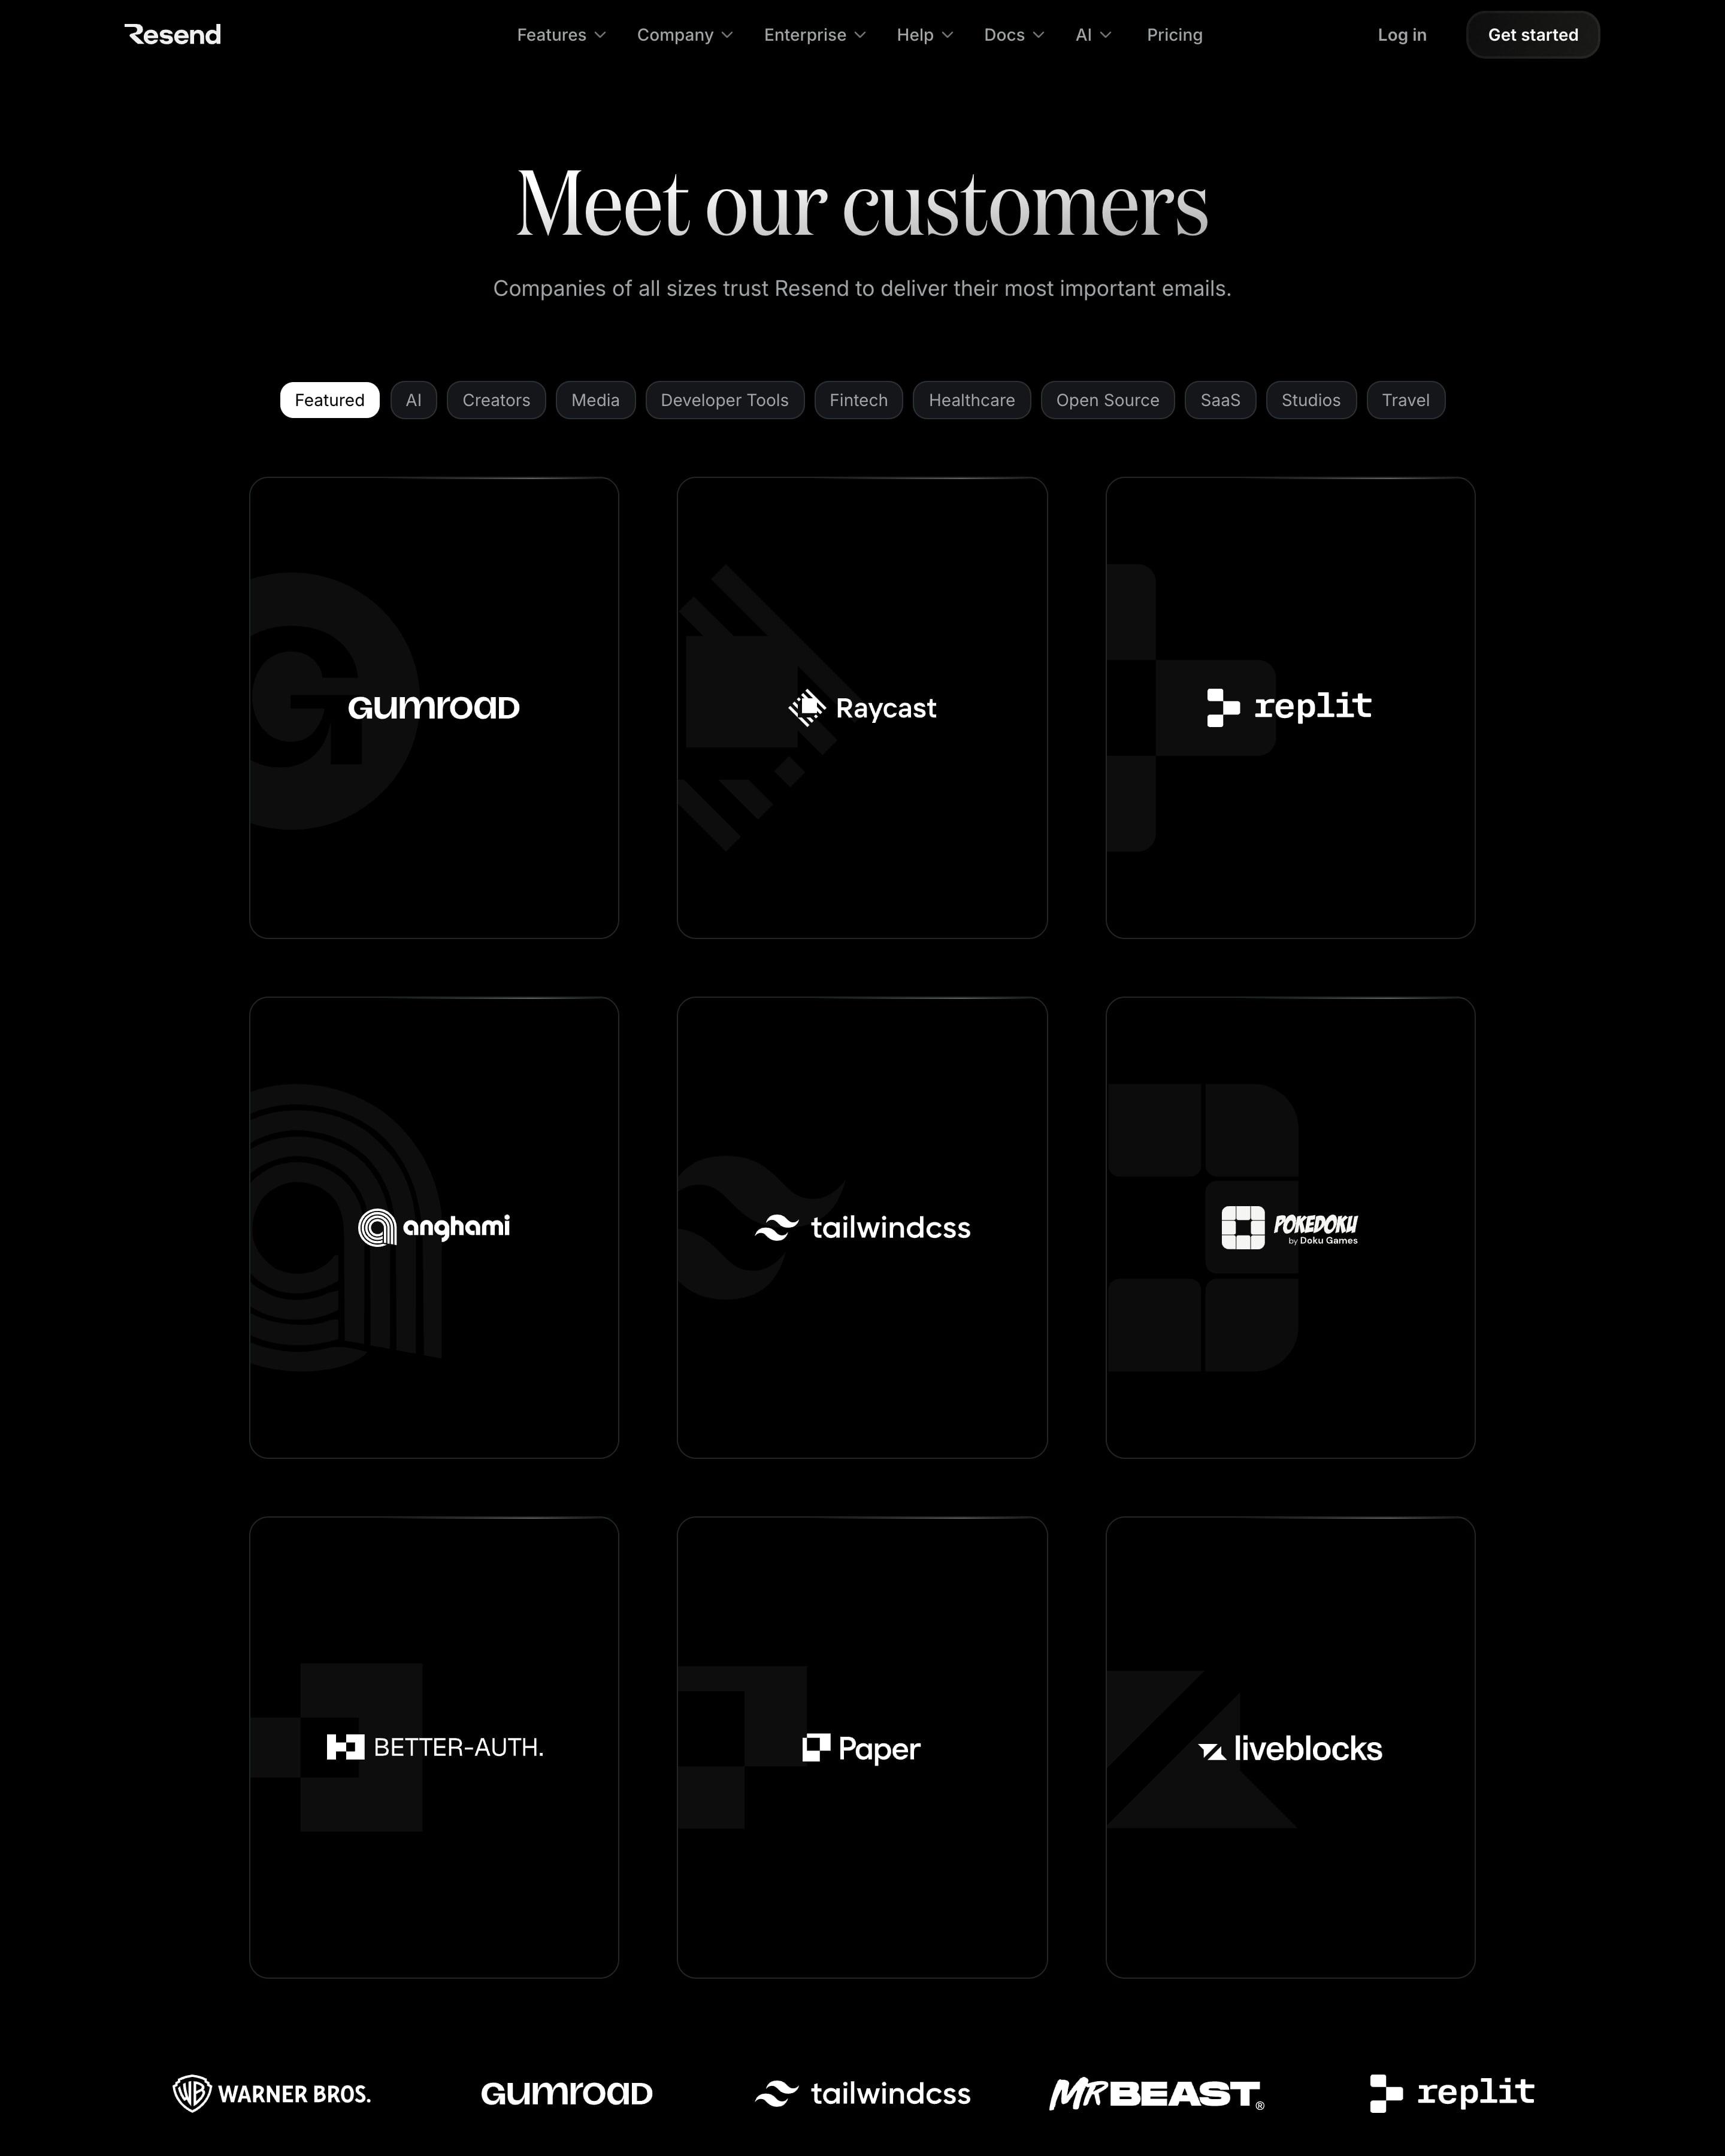
Category pills, from AI to Travel, sit above nine featured cards. Worth copying: each card puts a customer logo over a large, faded crop of its brand mark. Below sits a wall of over a hundred white logos, five to a row, with no quotes or numbers on view.
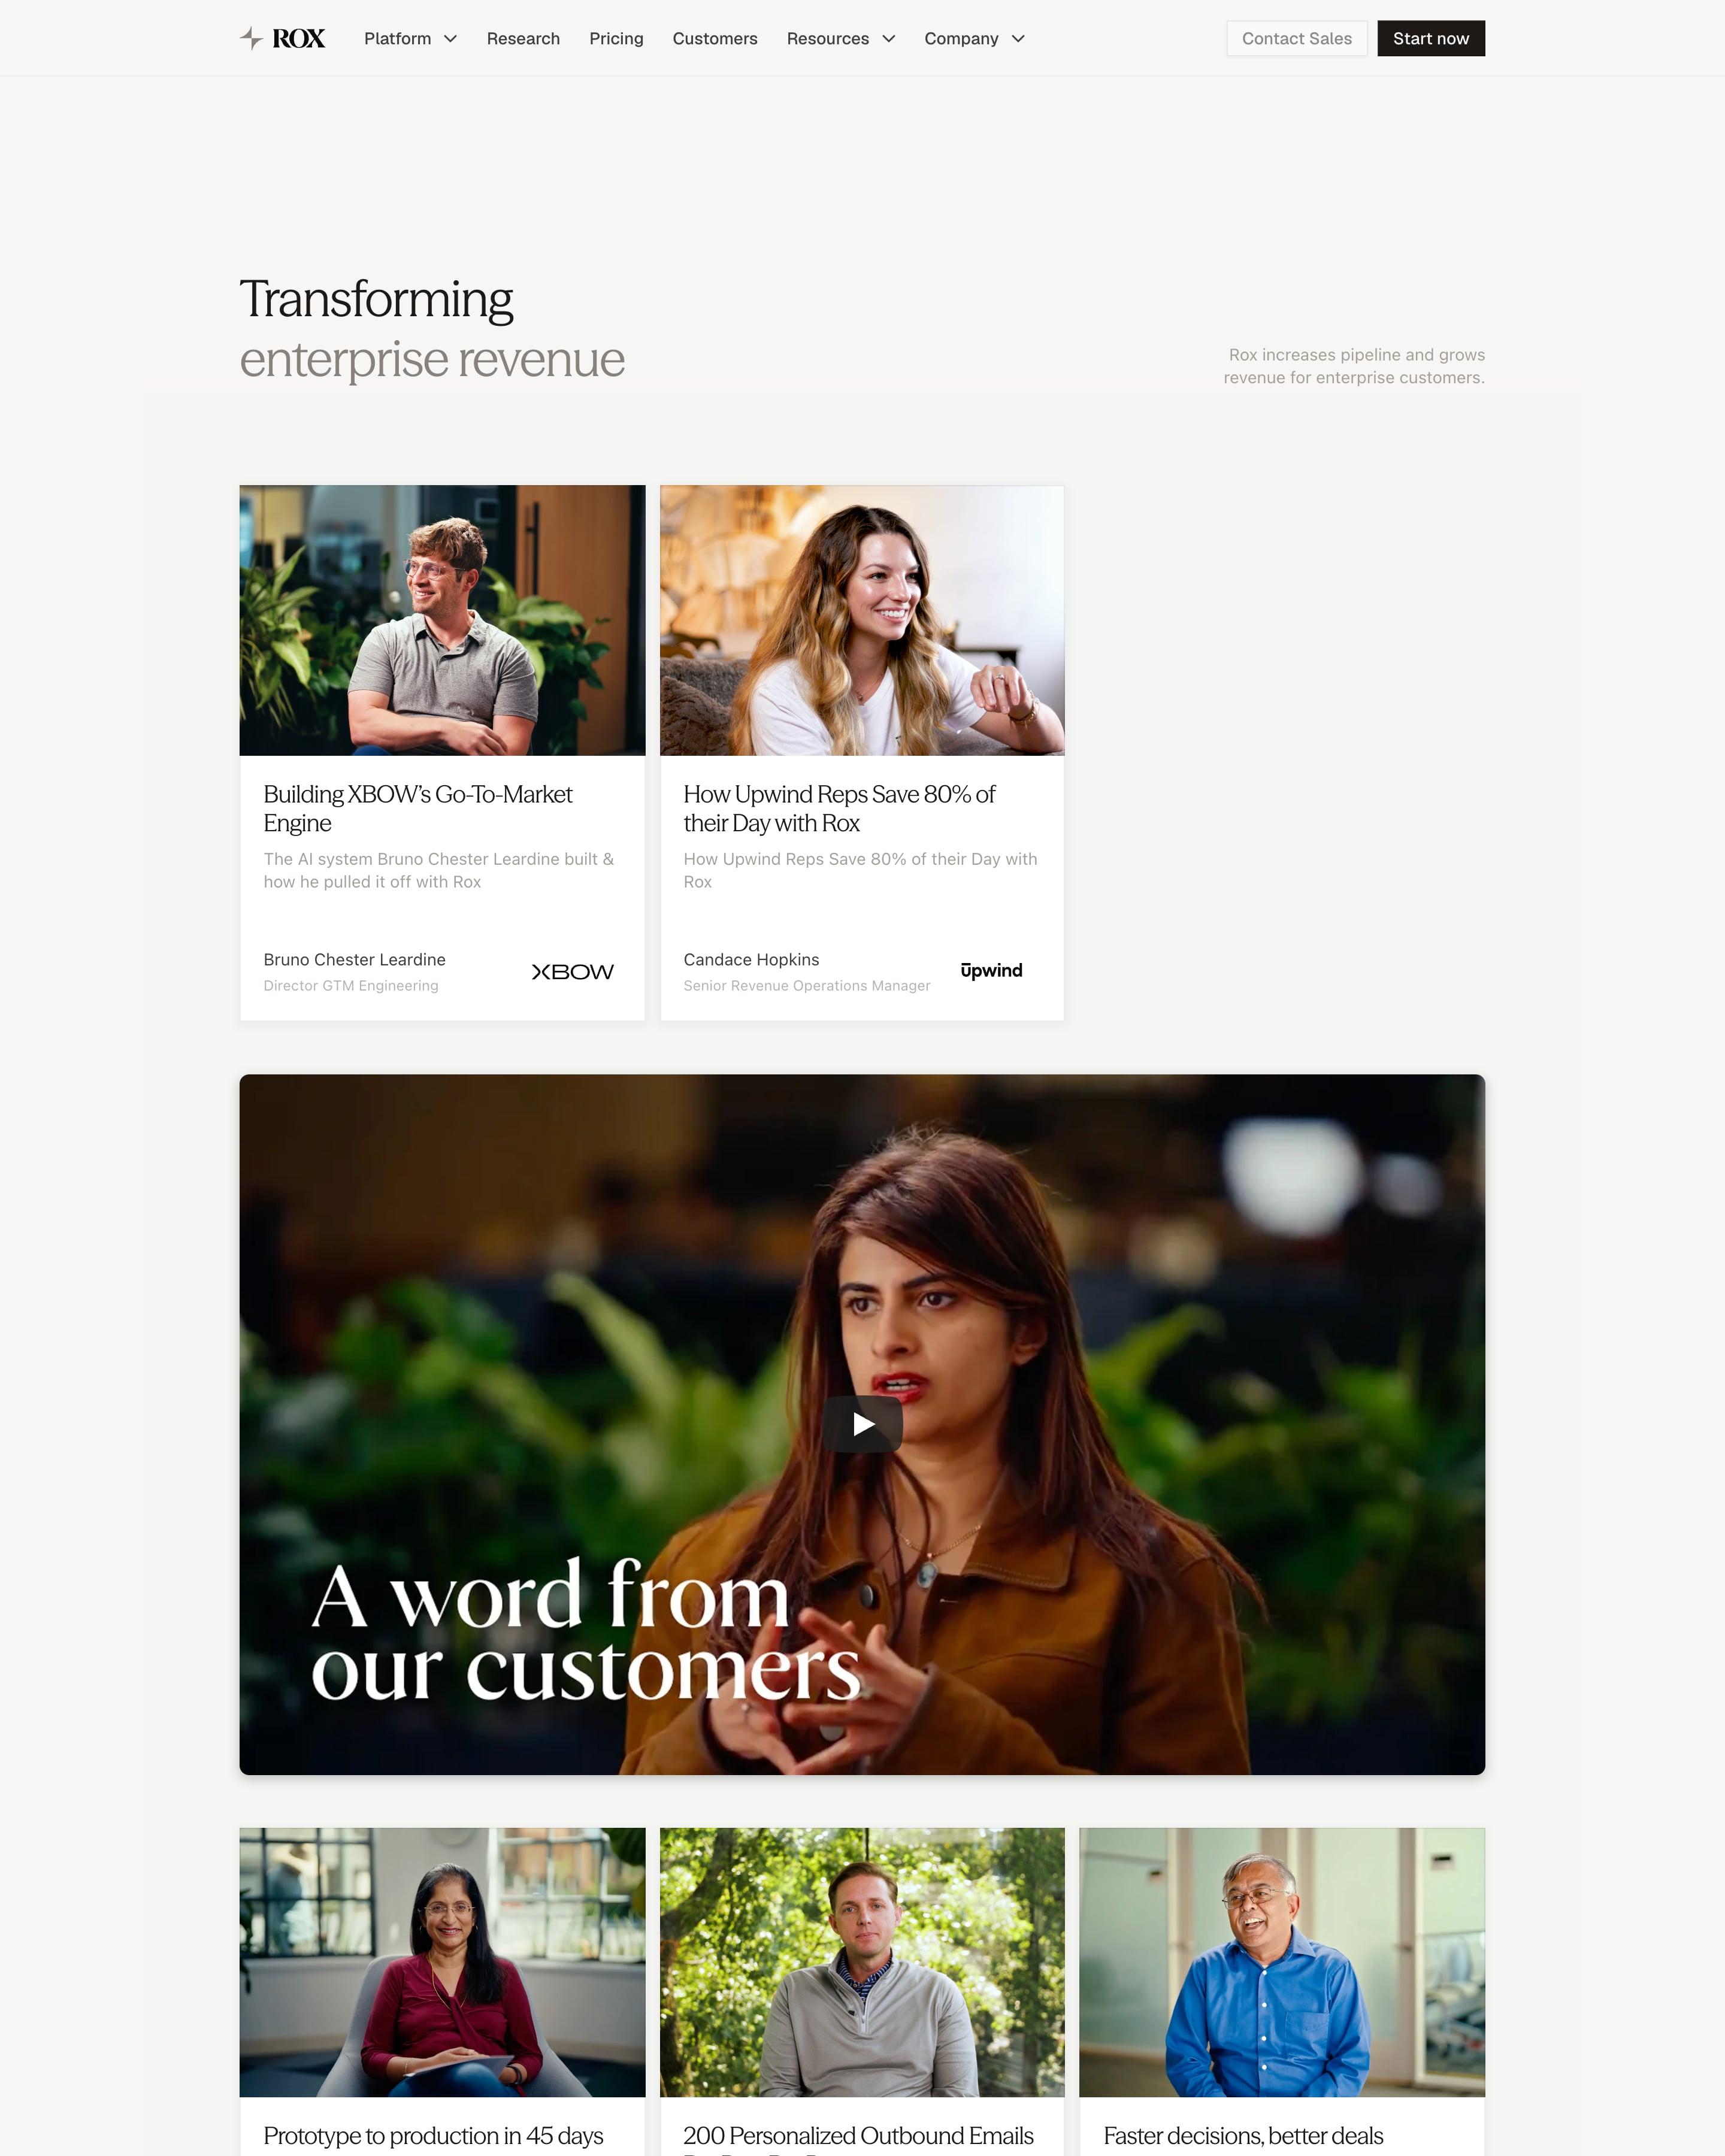
"Transforming enterprise revenue" leads into story cards with warm interview stills, a headline like "How Upwind Reps Save 80% of their Day", the speaker and a company logo. A full-width video titled "A word from our customers" in large white serif breaks the grid. Most headlines lead with a number: "10-15% conversion rate increase", "SAMs on Rox close 2.5x more ARR".
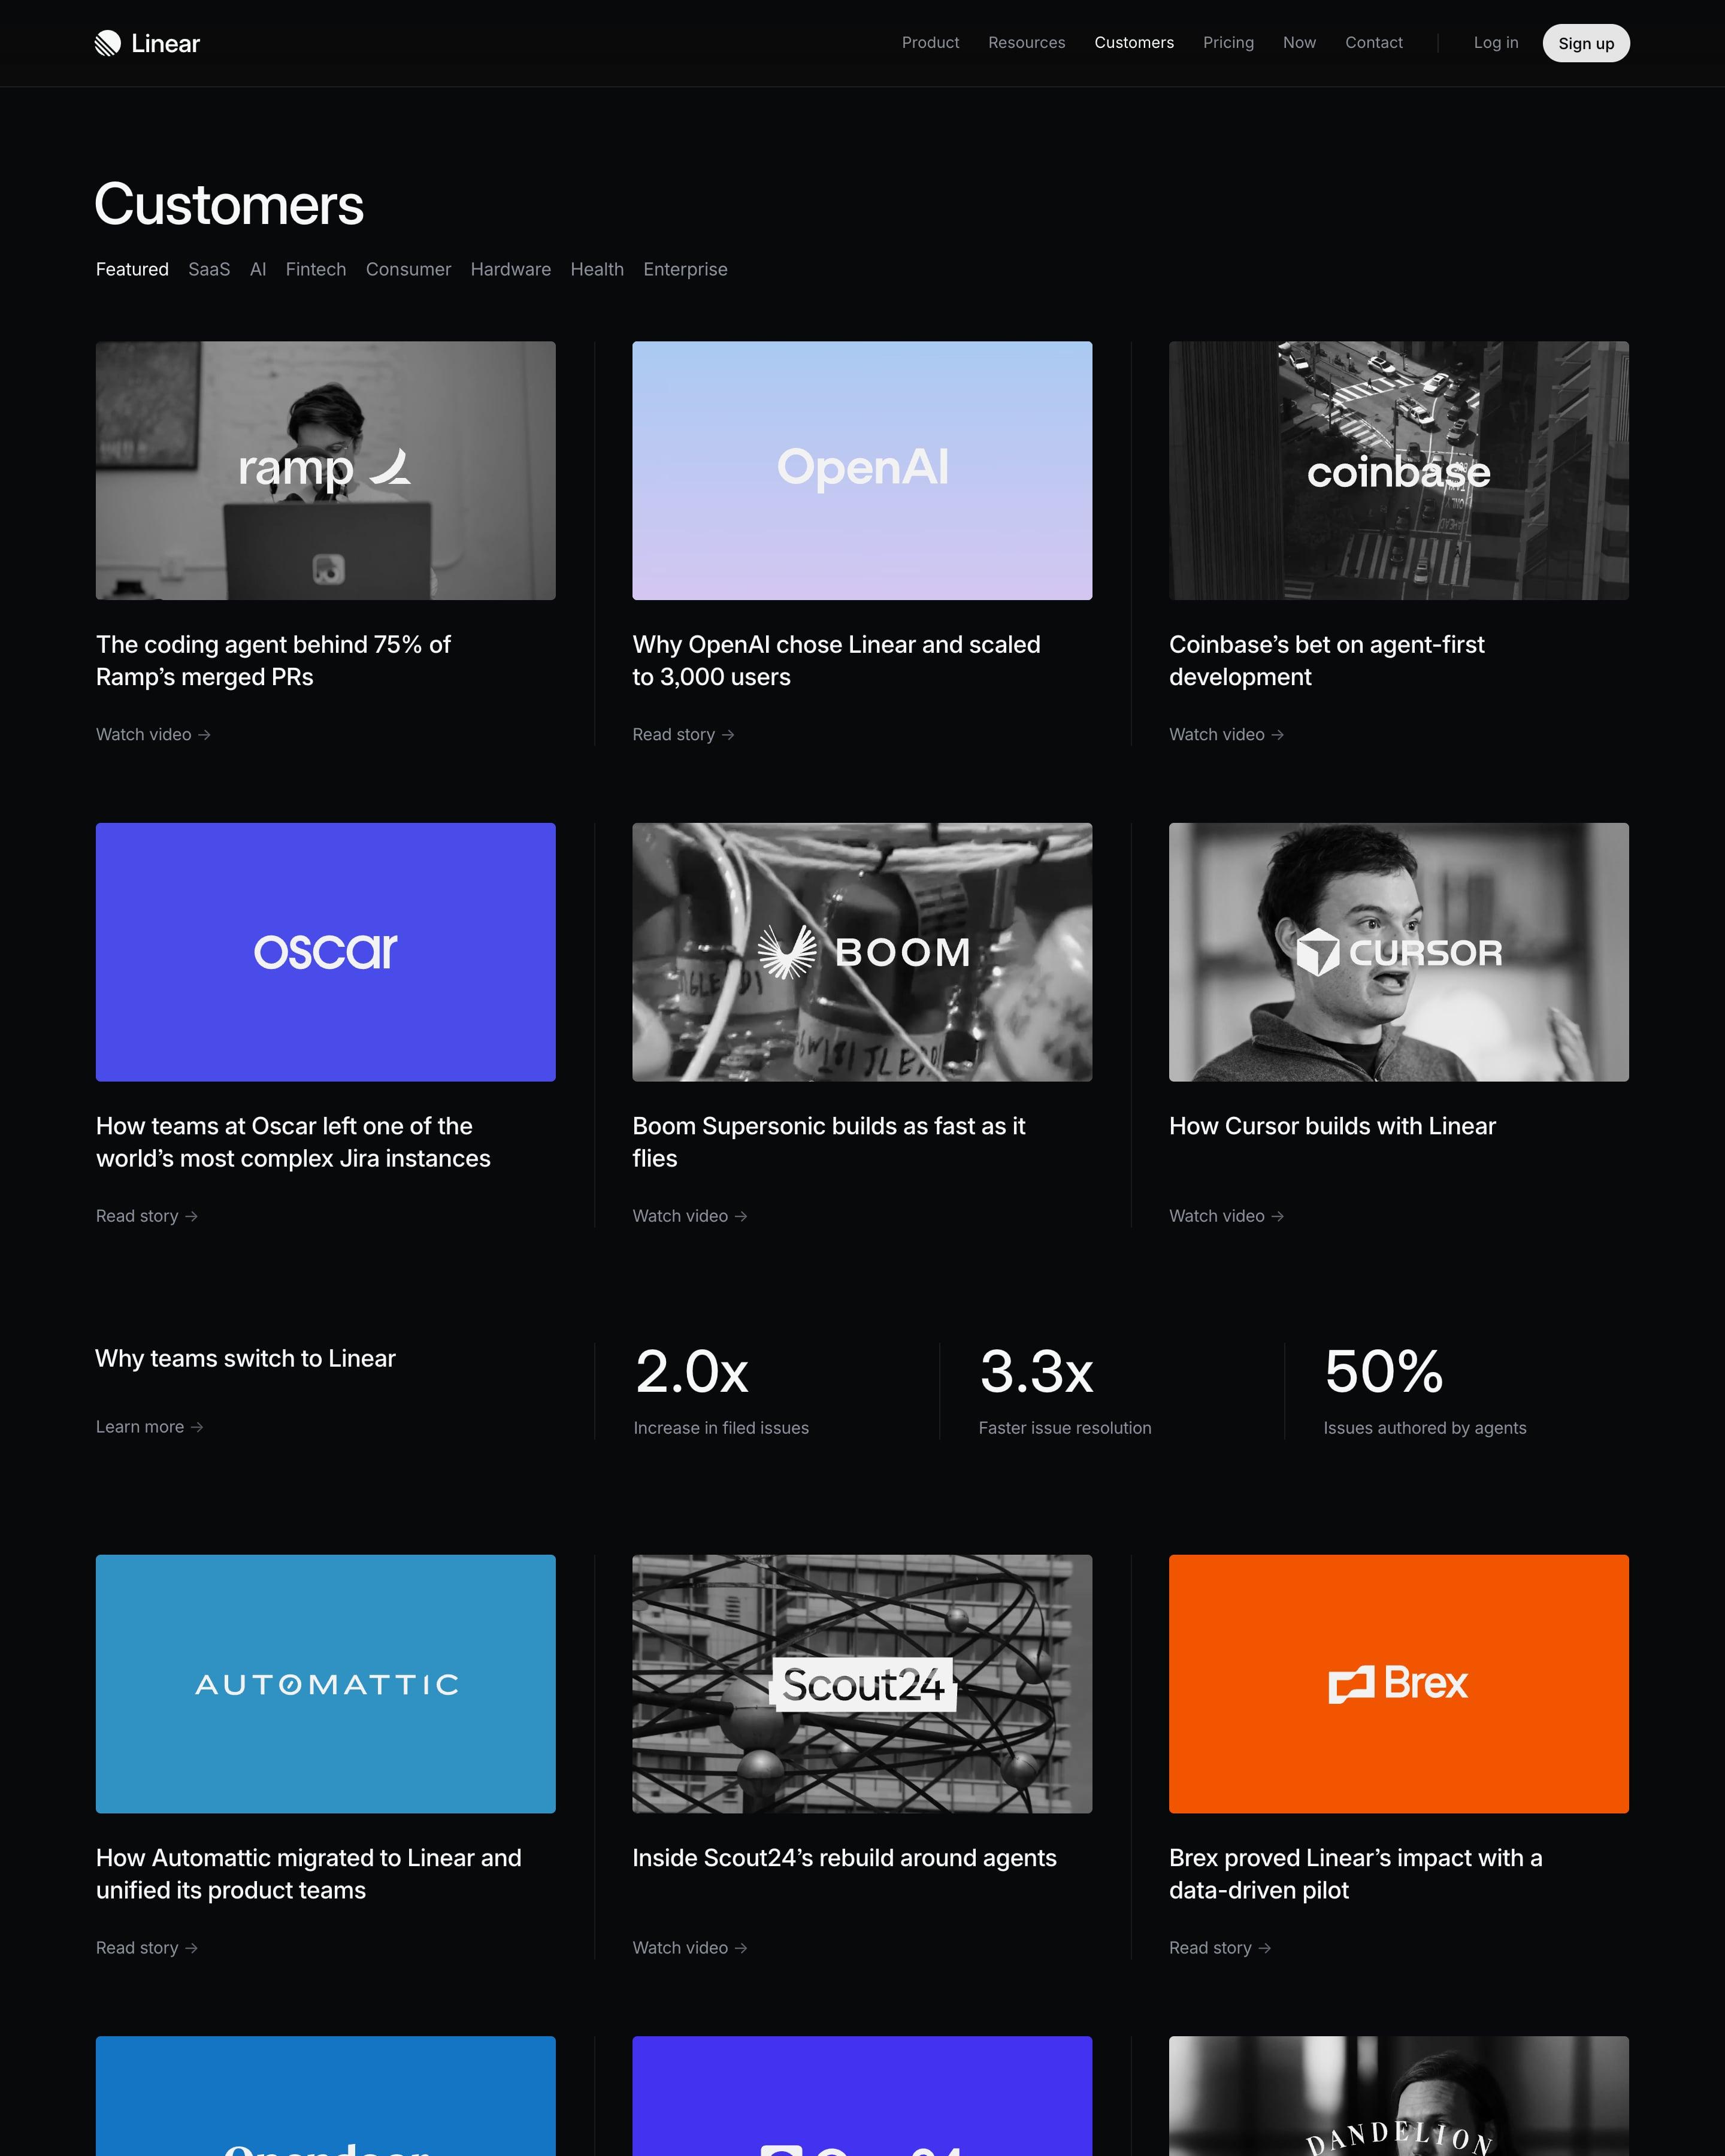
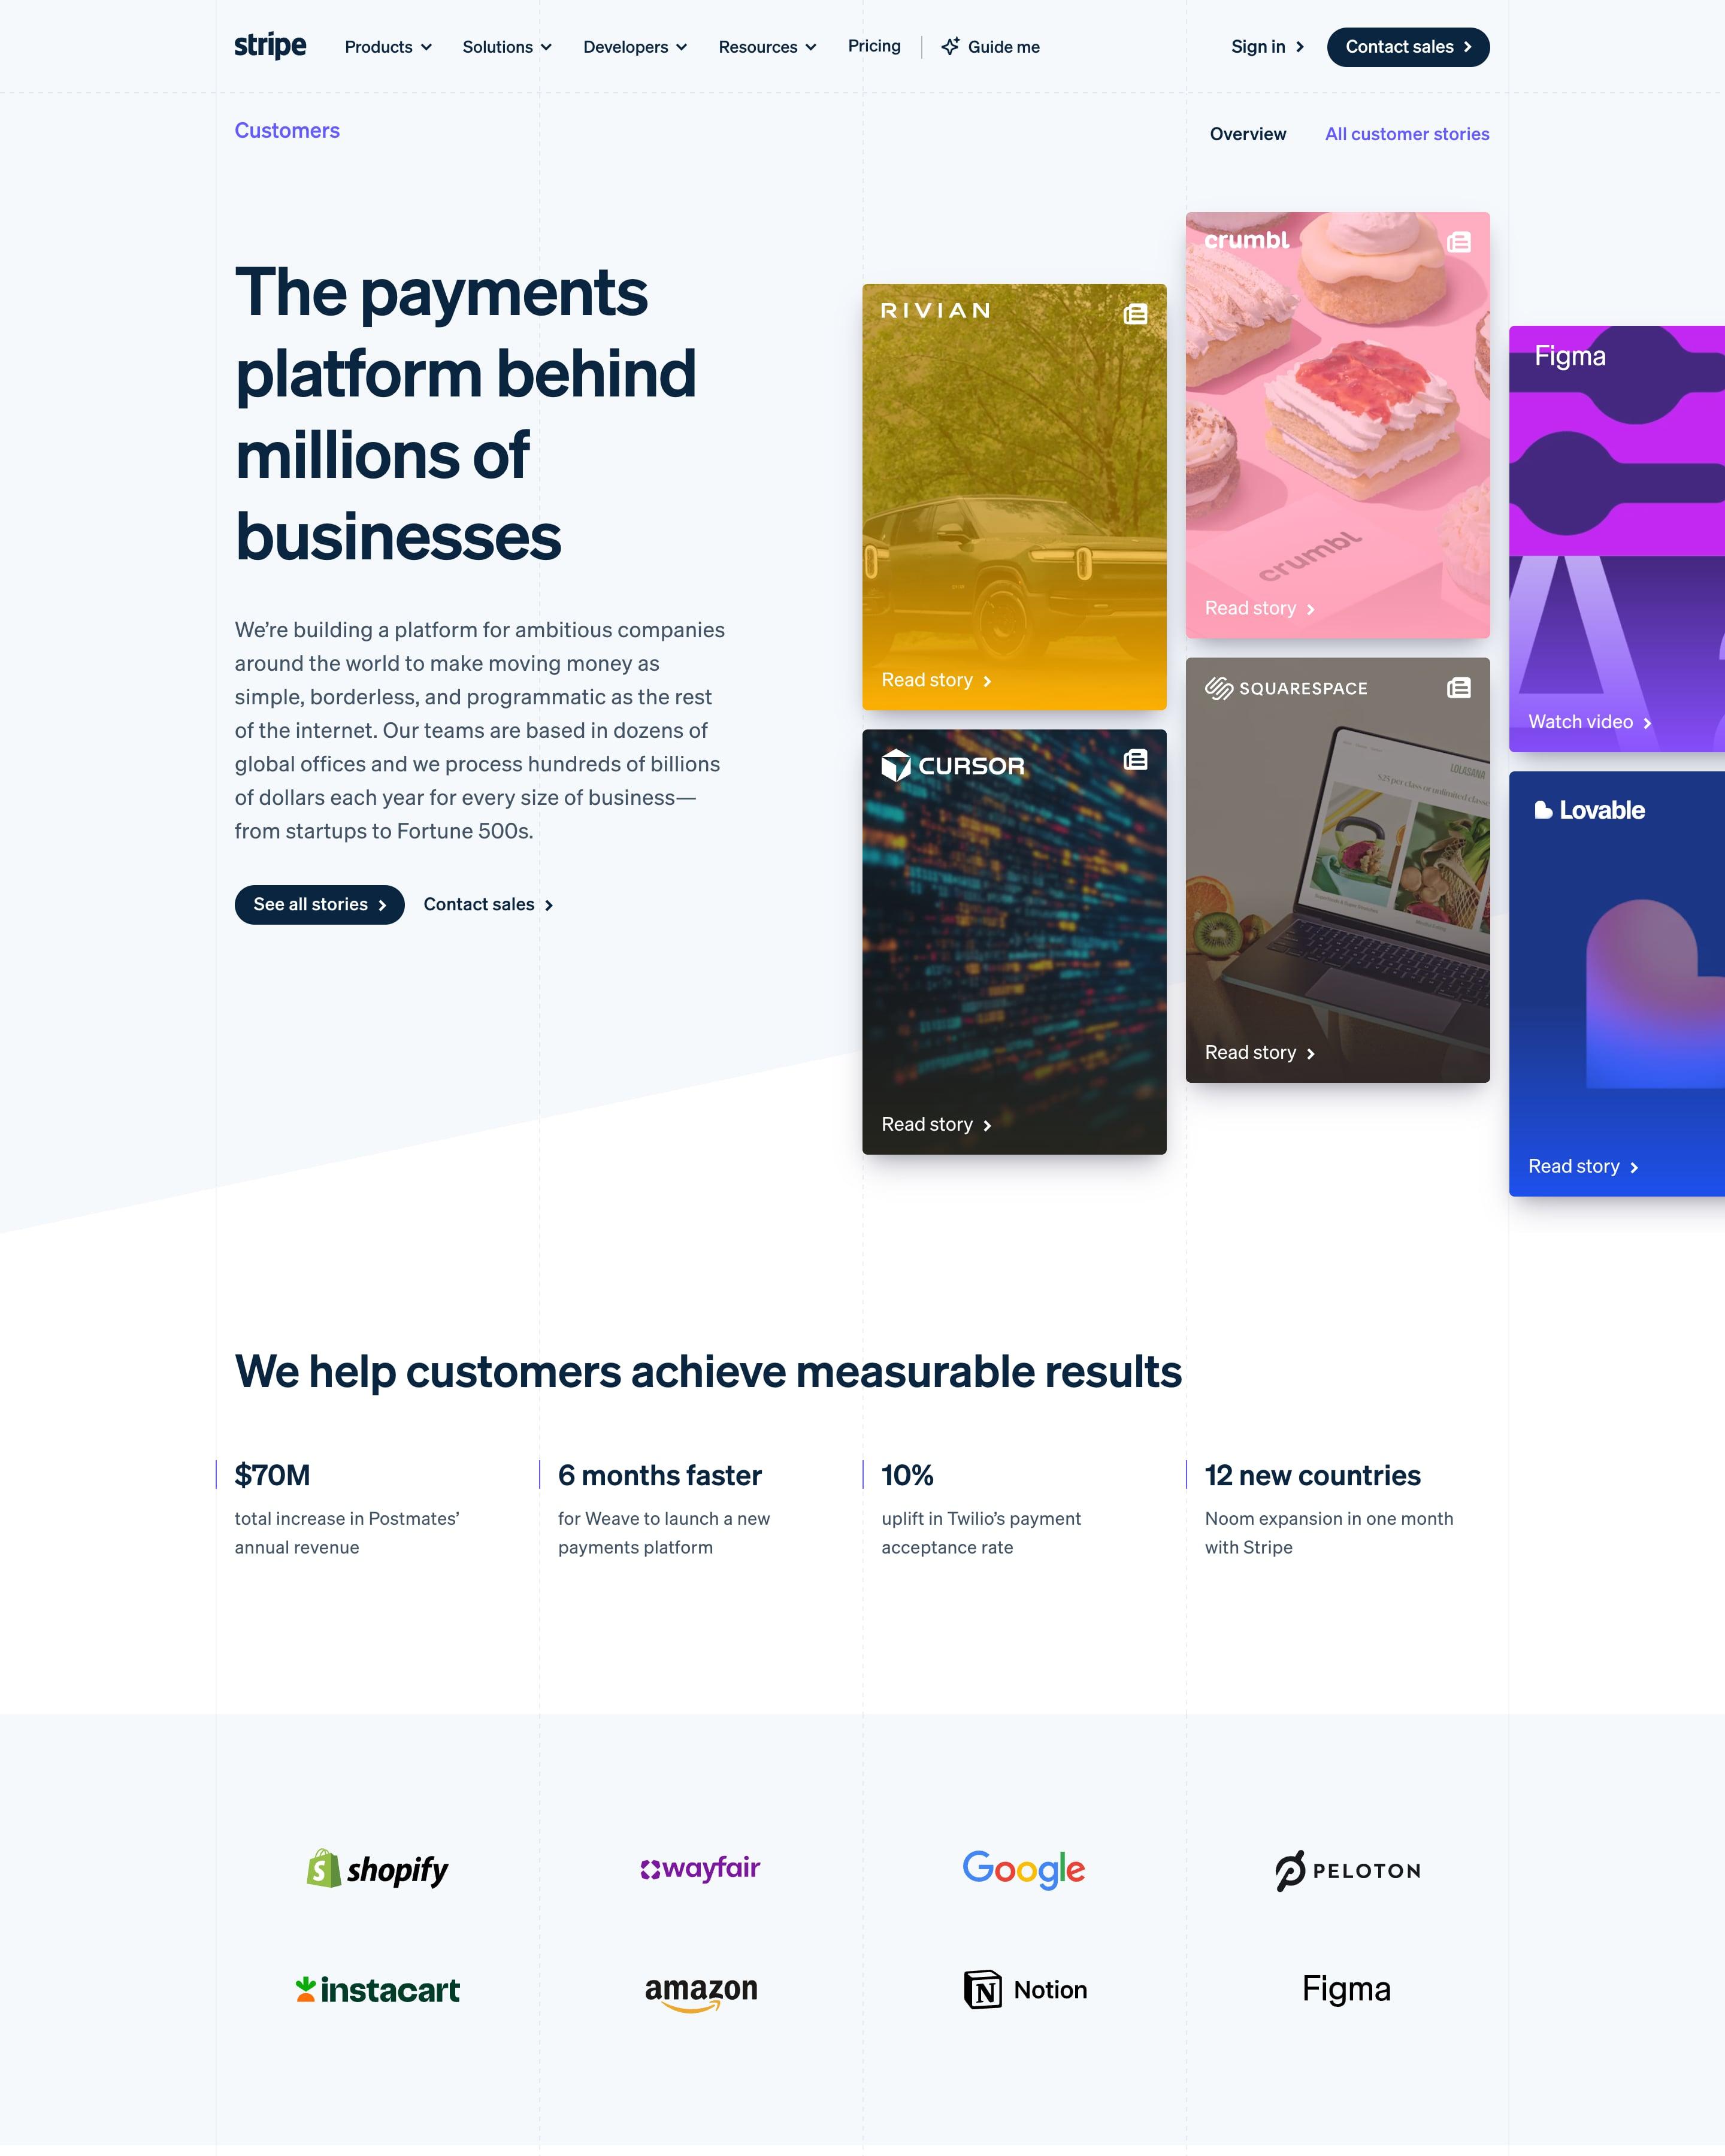
Hero story cards are images washed in each brand's colour (yellow Rivian, pink Crumbl, purple Figma), stacked in offset columns, and the use-case section repeats the idea as a mosaic. Tabs sort stories by size and use case. The Lyft story is the model: challenge, solution and products used, beside its app screen.
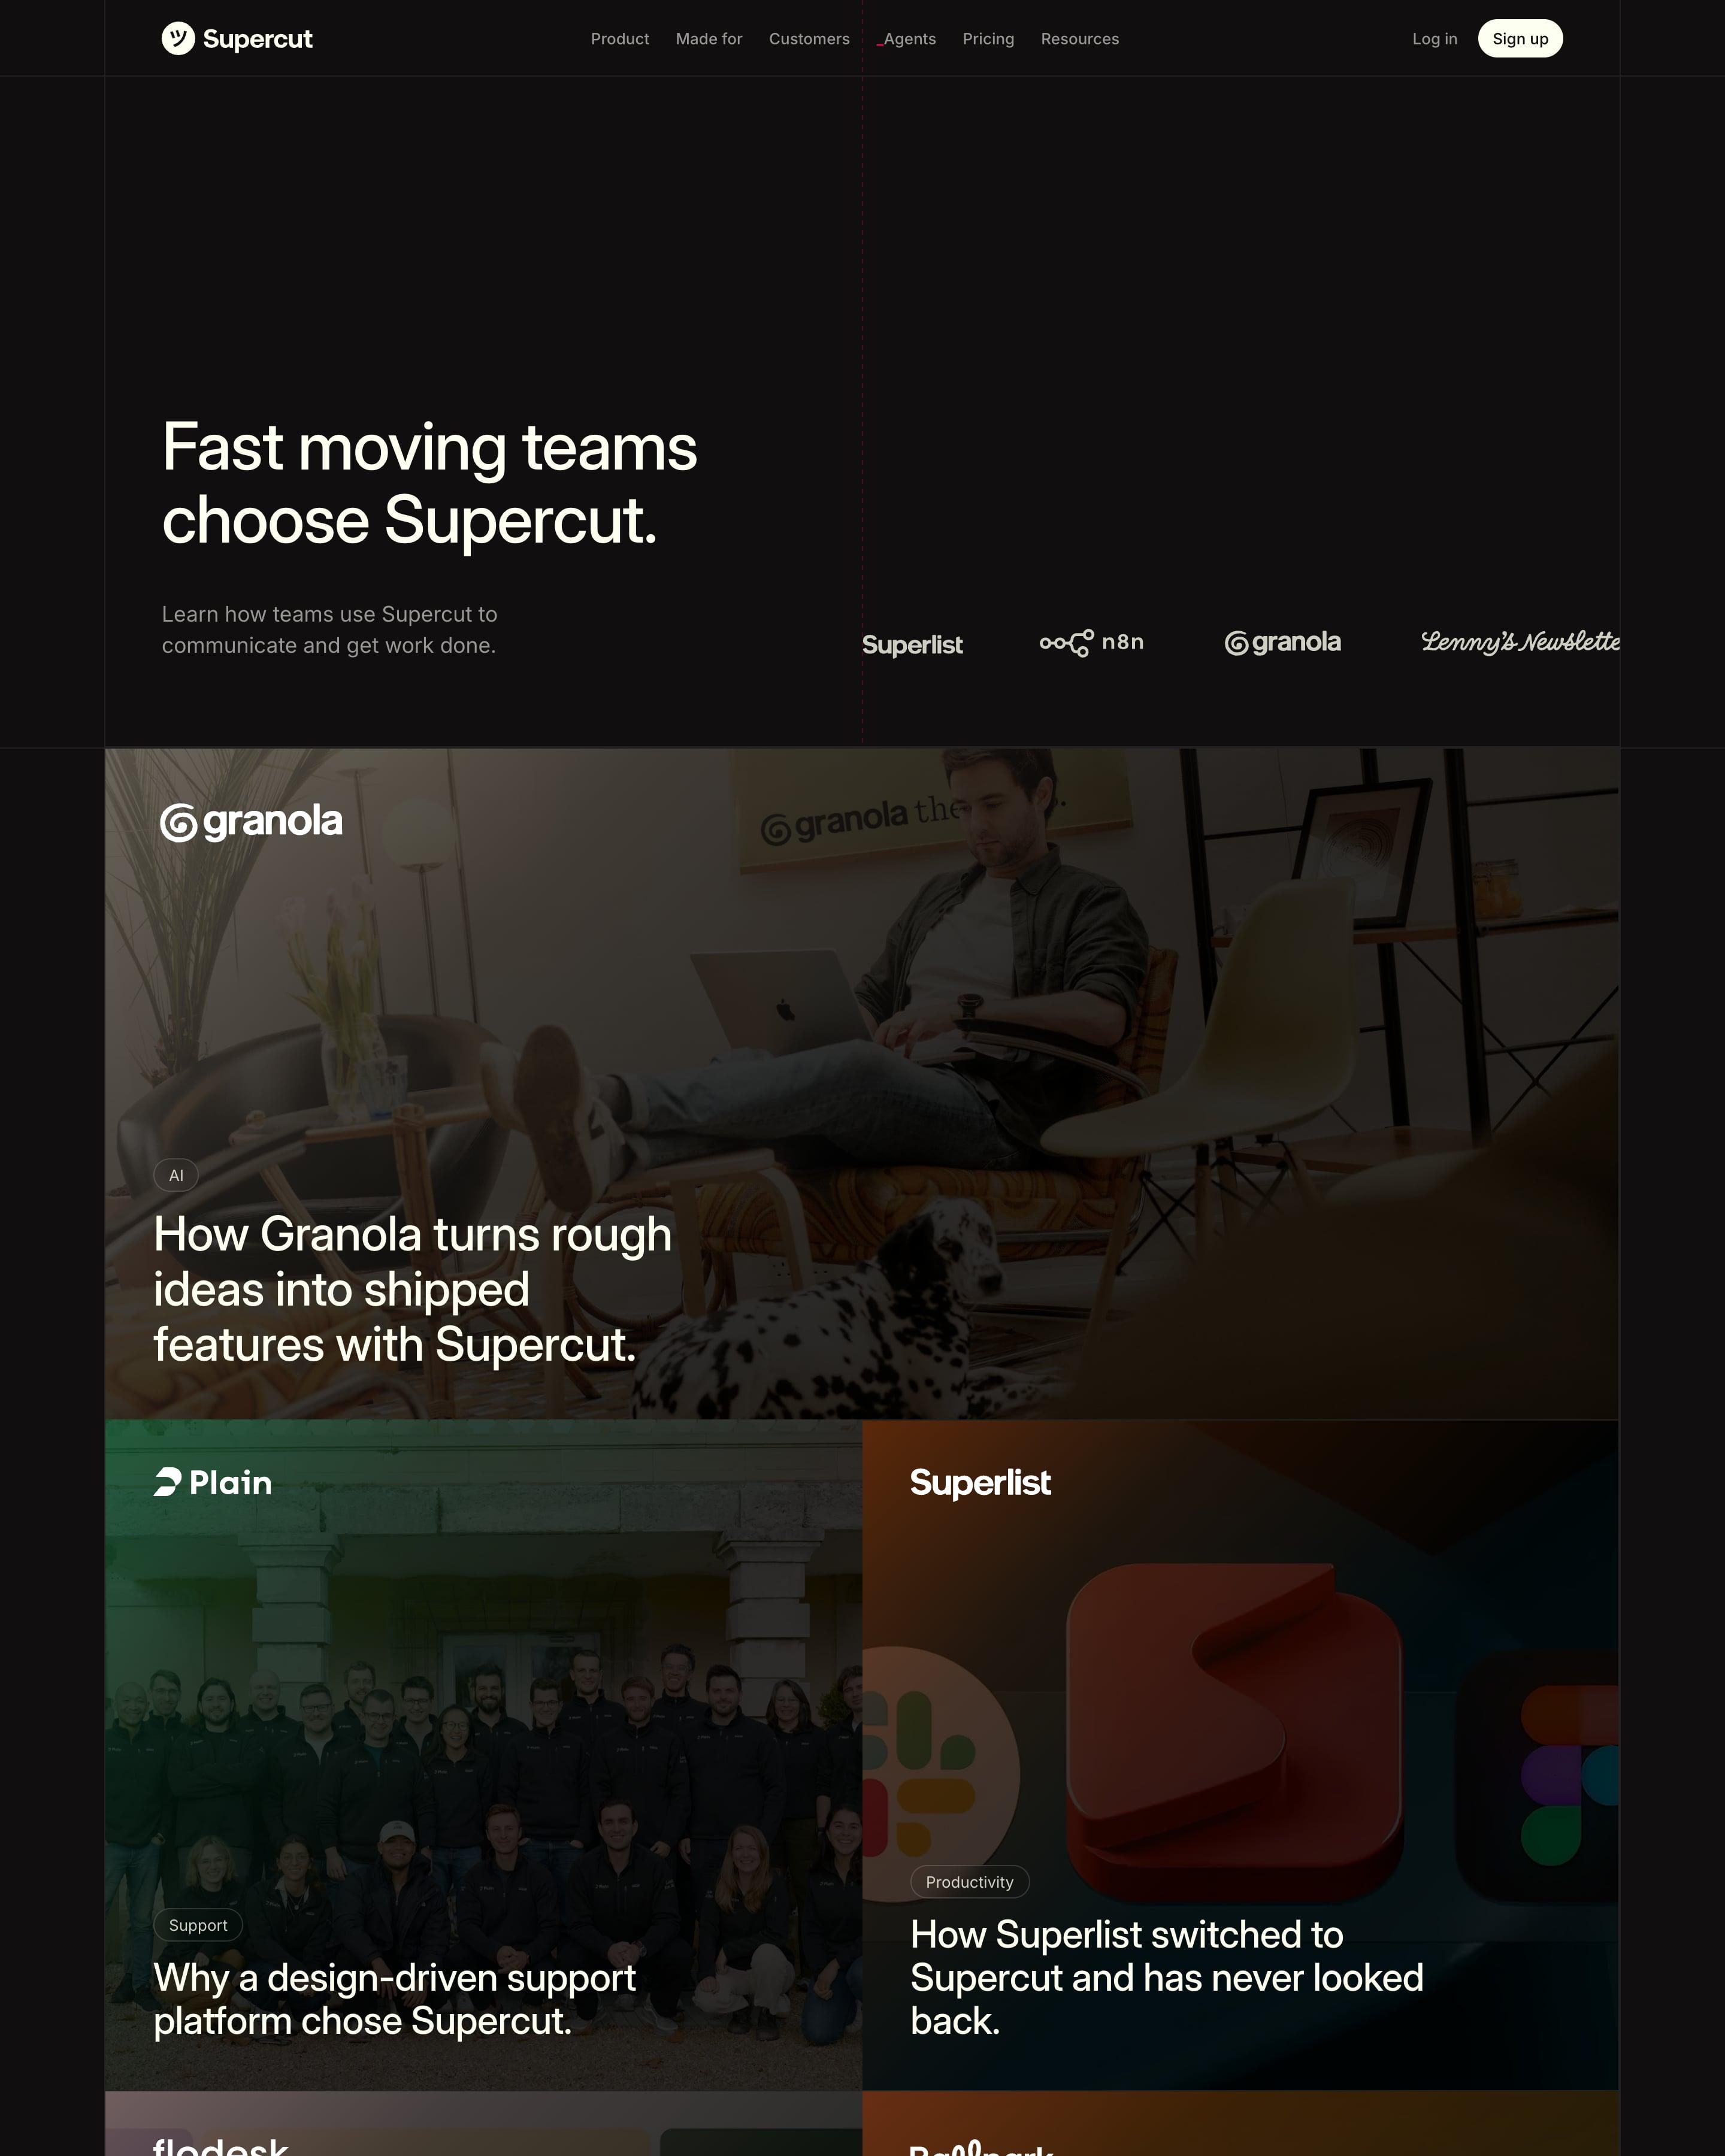
"Fast moving teams choose Supercut." sits beside a logo row, then the stories form a tight grid: Granola full width, then pairs for Plain, Superlist, Flodesk, Ballpark, Lottie and Speechly. Each tile is a darkened photo with a white logo, a small industry pill and a one-line headline. Worth copying: no gutters between tiles, so the grid reads as one wall.
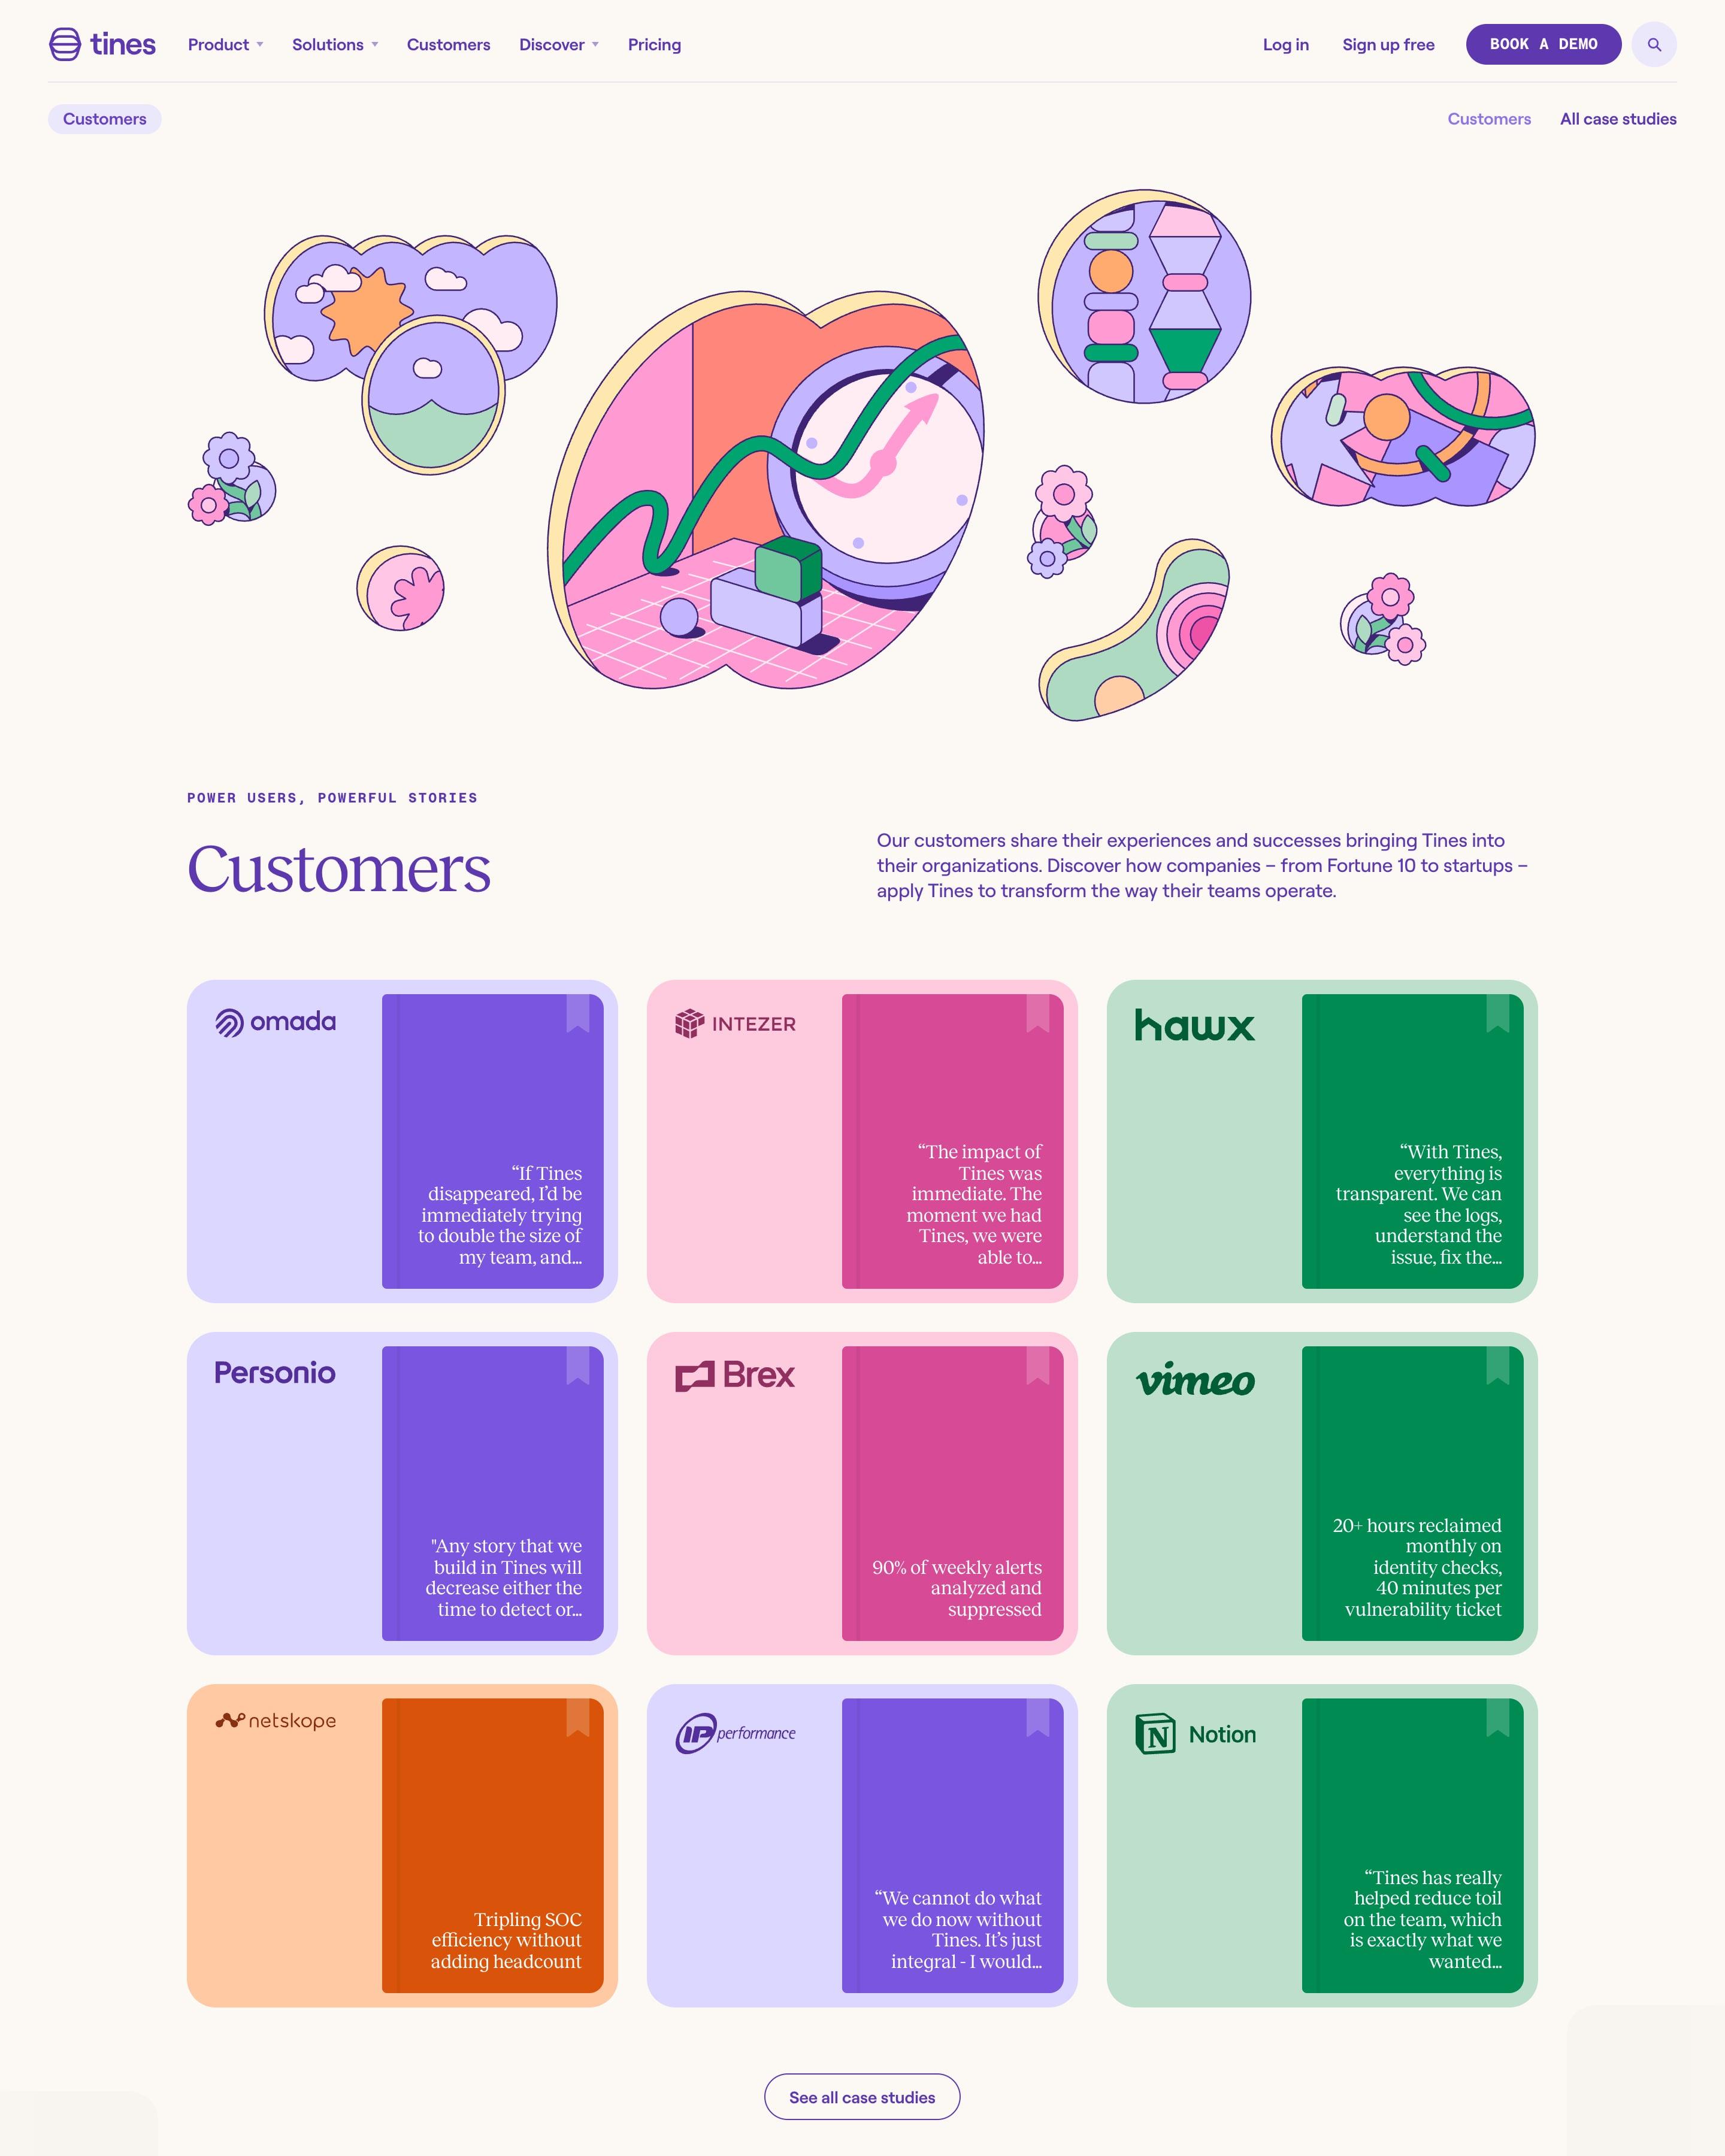
Each case study appears as a coloured book with a bookmark ribbon and its quote on the cover, set in a 3×3 grid of pastel cards. Below, a masonry wall mixes G2 reviews, badges, a Gartner card and single big results. Copy the wall: one palette makes mixed proof look like a set.
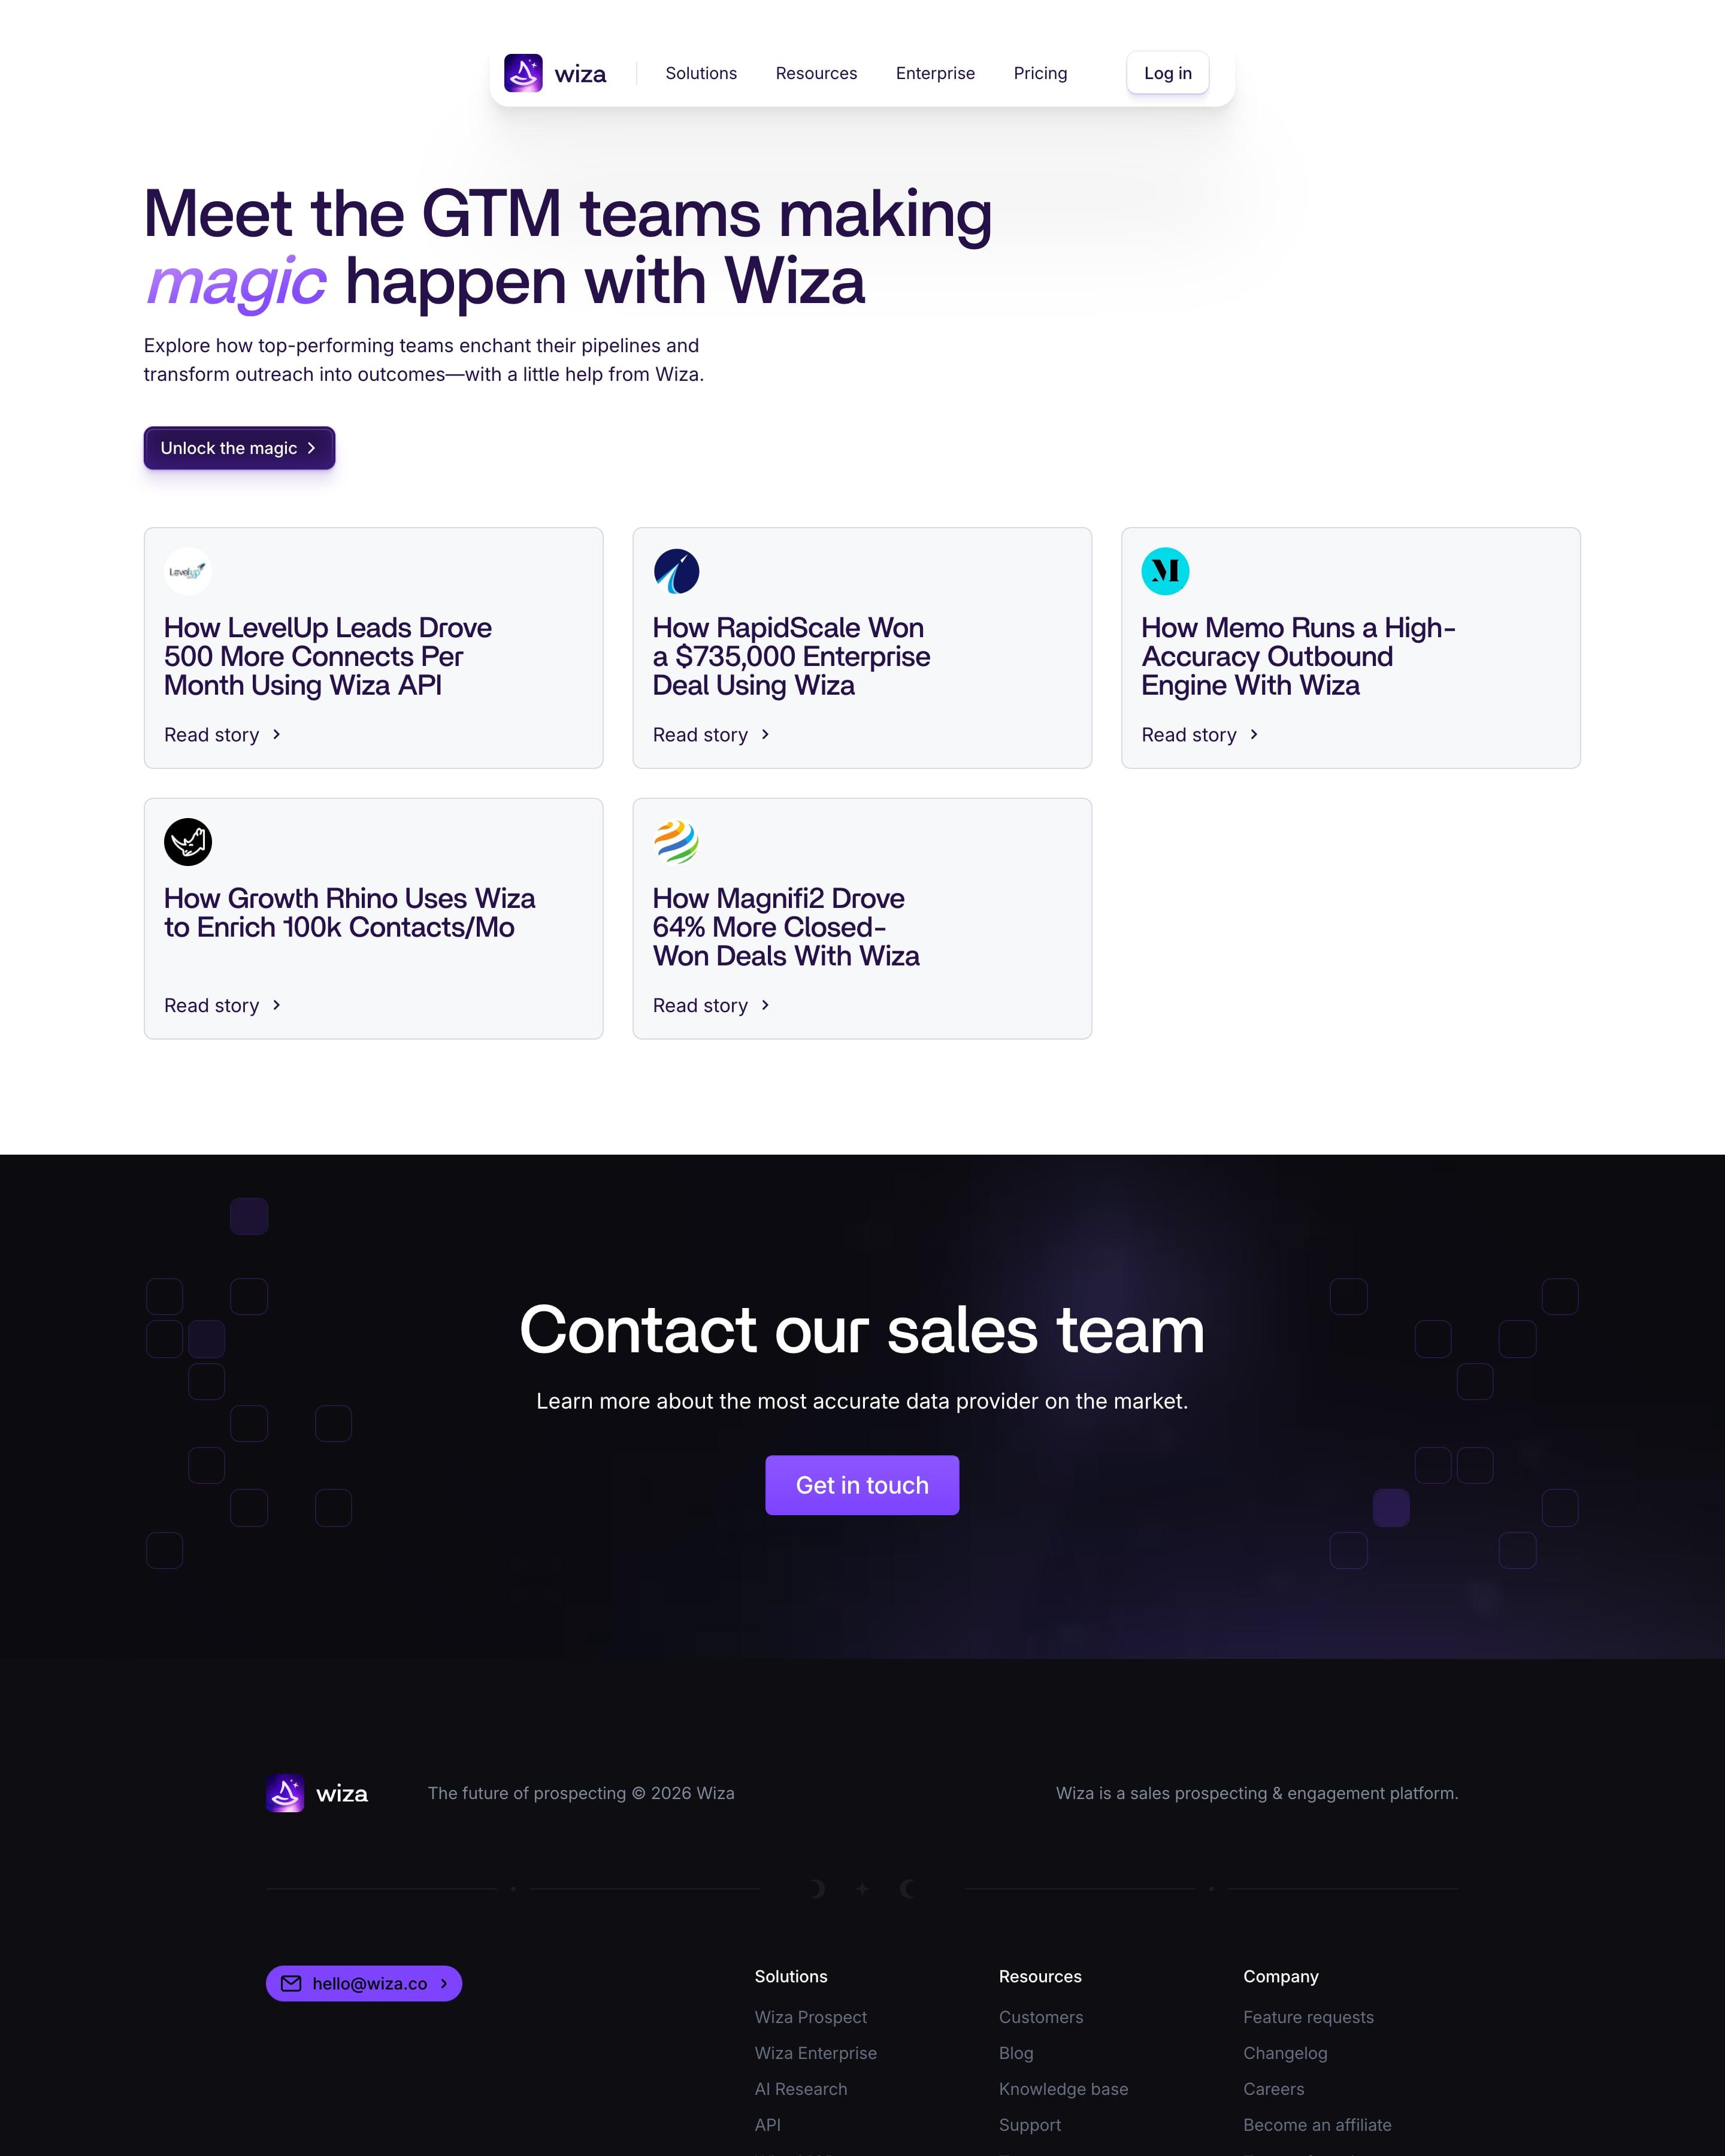
The stories sit on five grey cards, each with a small round logo, a Read story link and a headline worth copying because it names the number: '500 More Connects Per Month', 'a $735,000 Enterprise Deal'. In the top heading, 'magic' is set in purple italics, and a dark sales band follows.
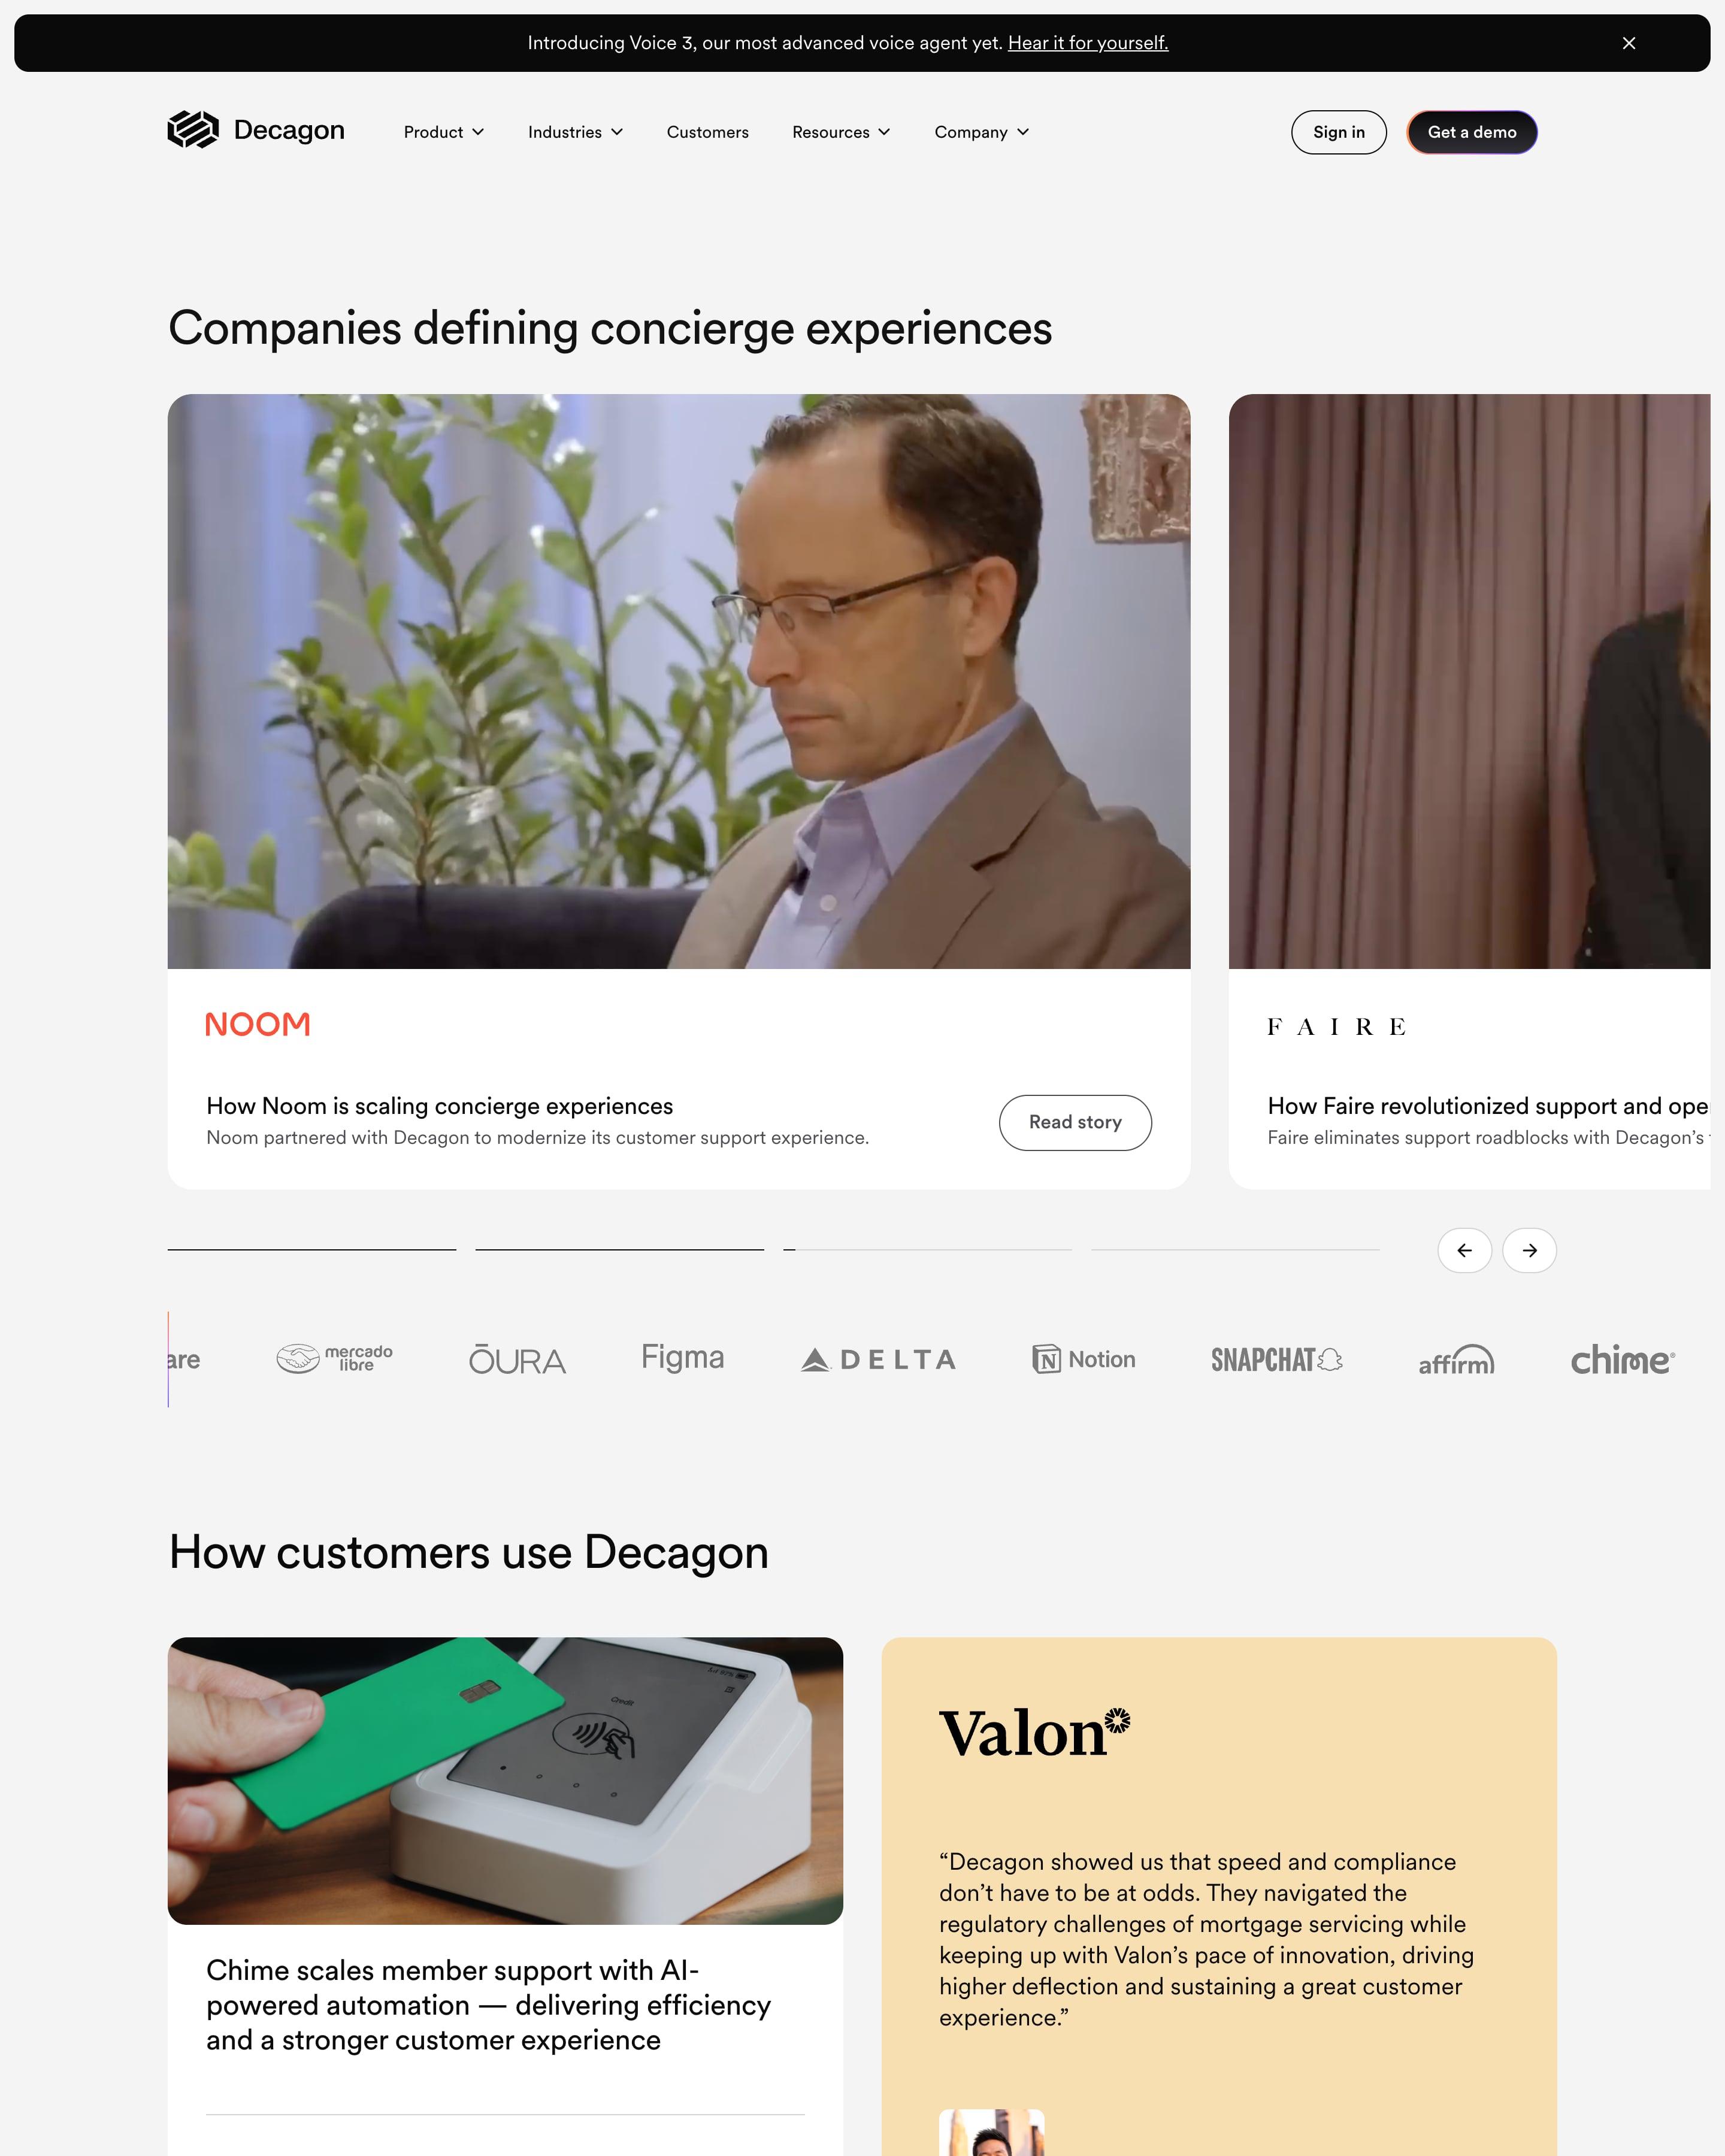
Large photo cards for Noom and Faire sit in a carousel under the headline. Below, "How customers use Decagon" alternates white cards ending in one metric, like $1M, with pastel quote cards in yellow, blue and green, a rhythm worth copying. A three-column archive of photo cards follows.
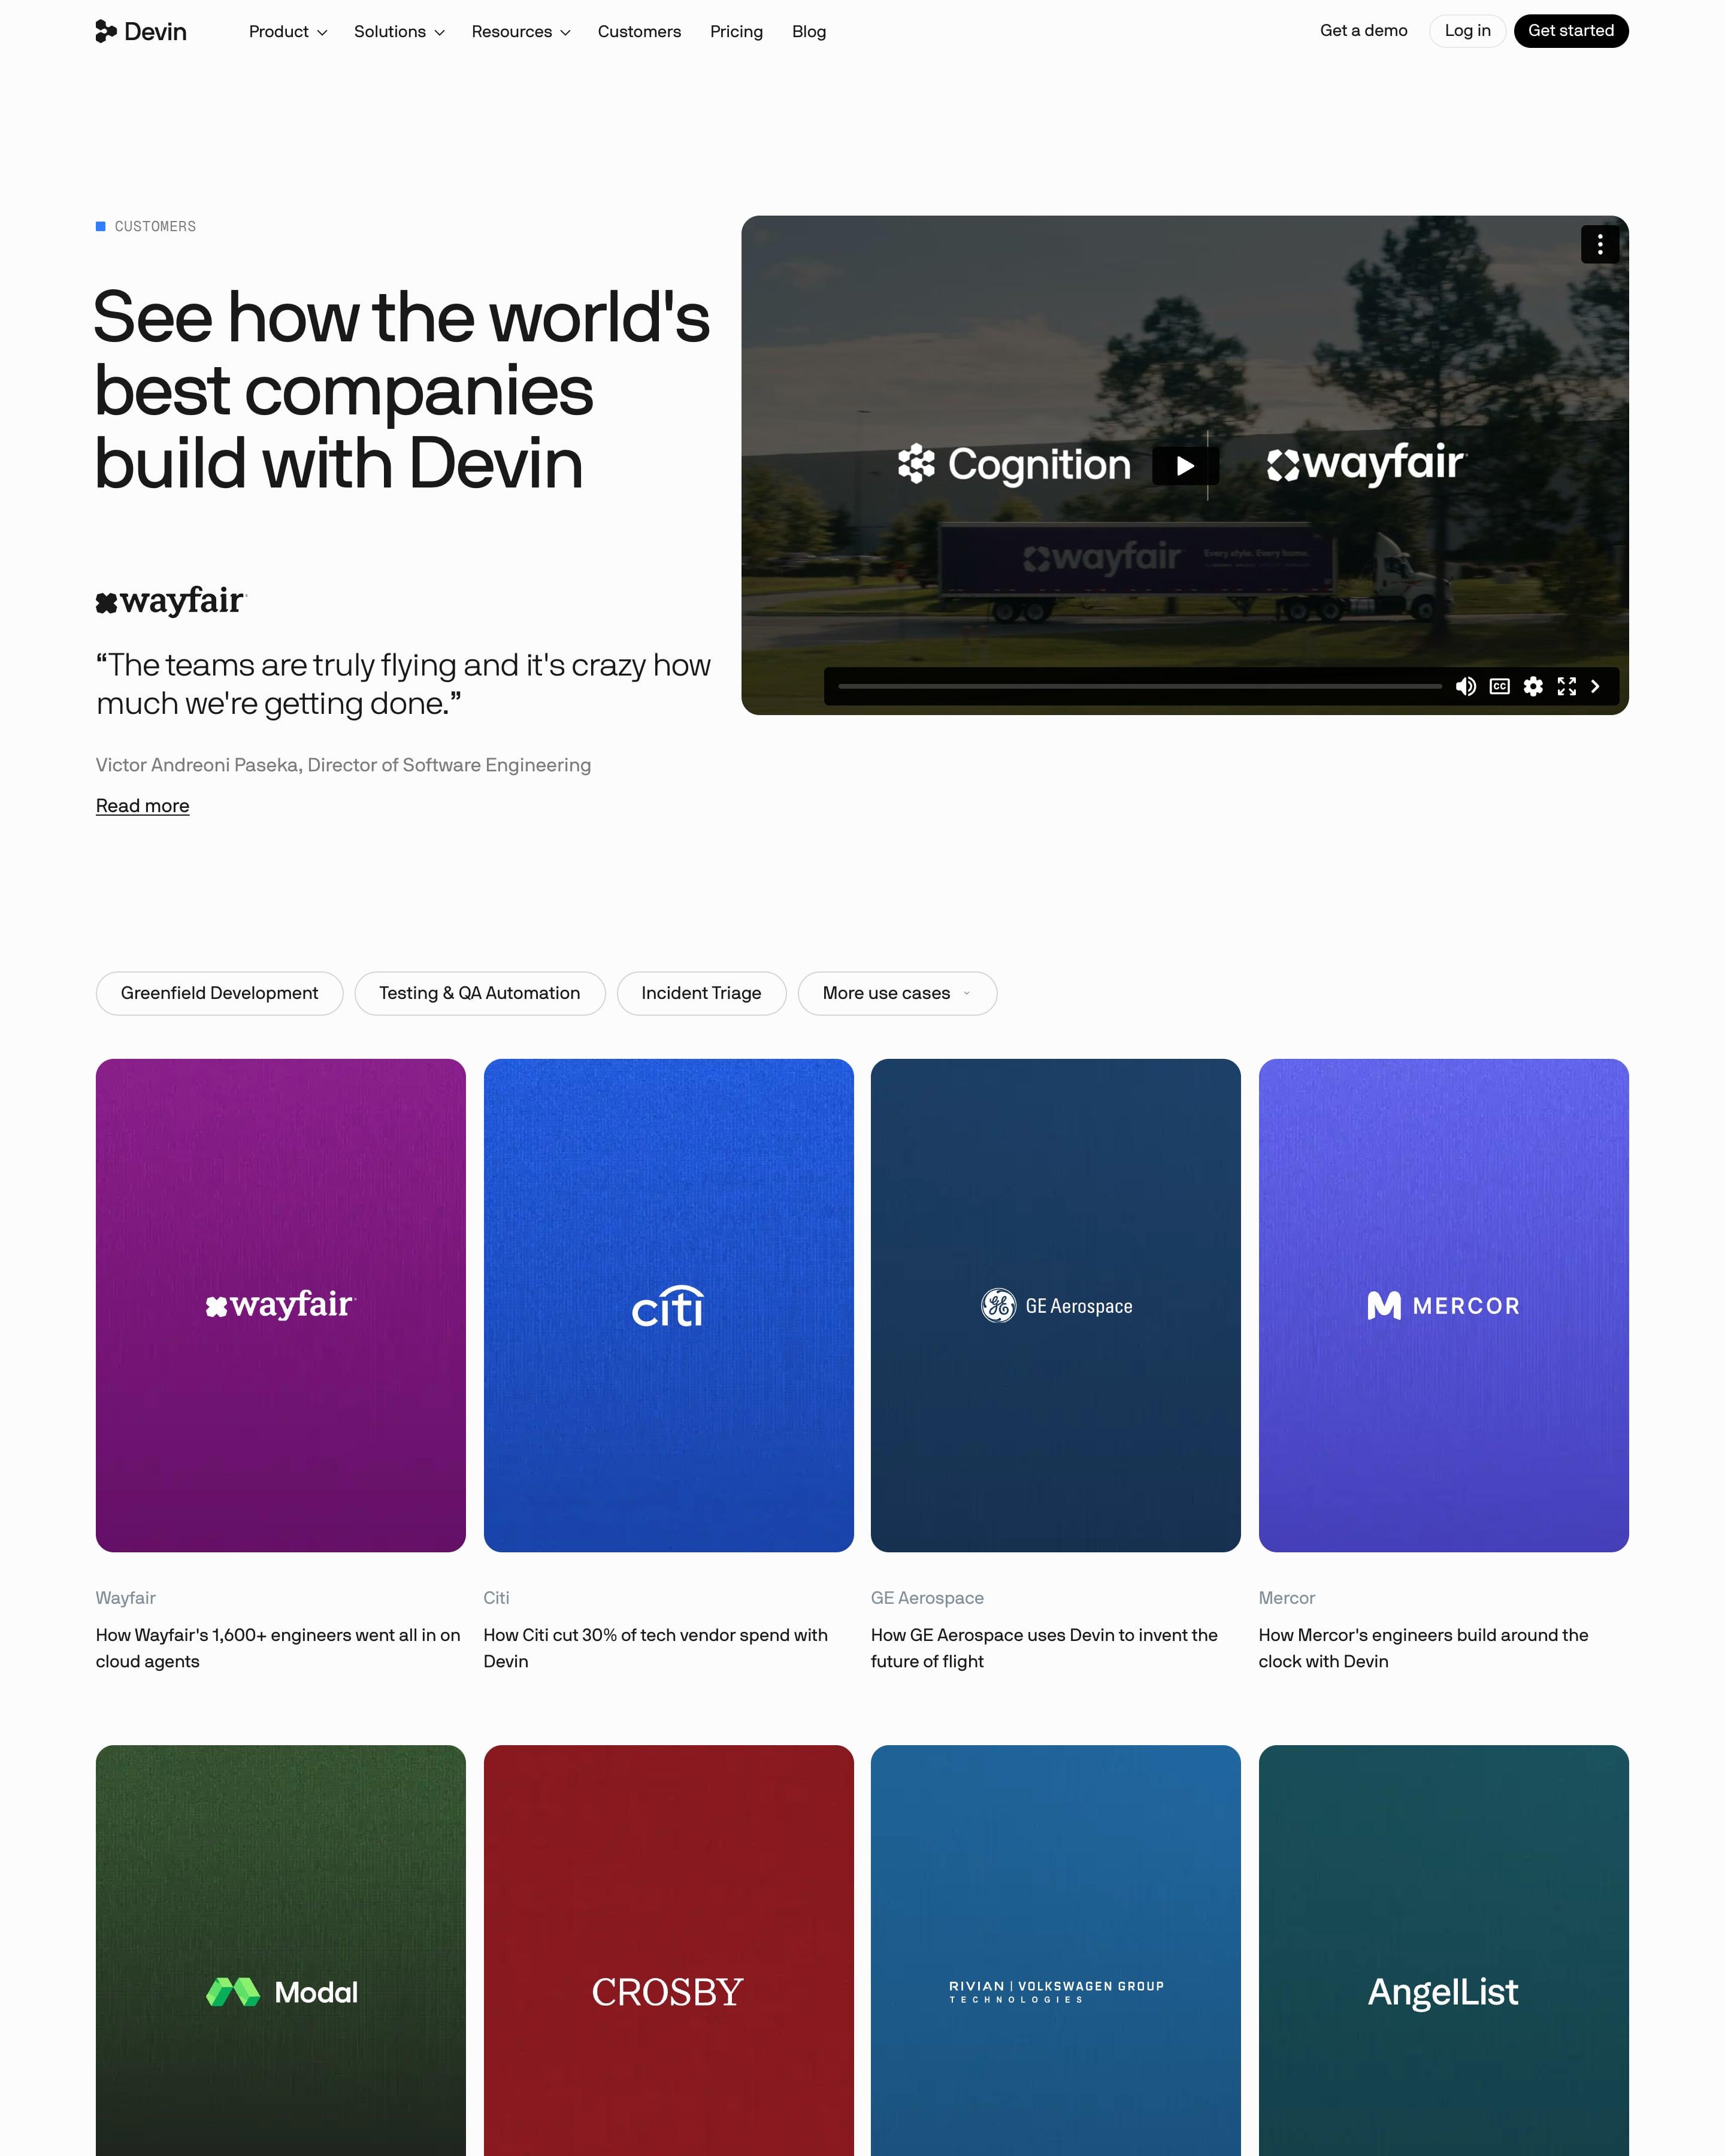
"See how the world's best companies build with Devin" sits beside a Cognition × Wayfair video. Below, more than 30 tall portrait cards each fill one deep colour, purple for Wayfair, blue for Citi, green for Modal, with the white logo centred and a one-line result underneath. A staggered grid of stat tiles like "40,000+ Devin-authored PRs merged" closes the page.
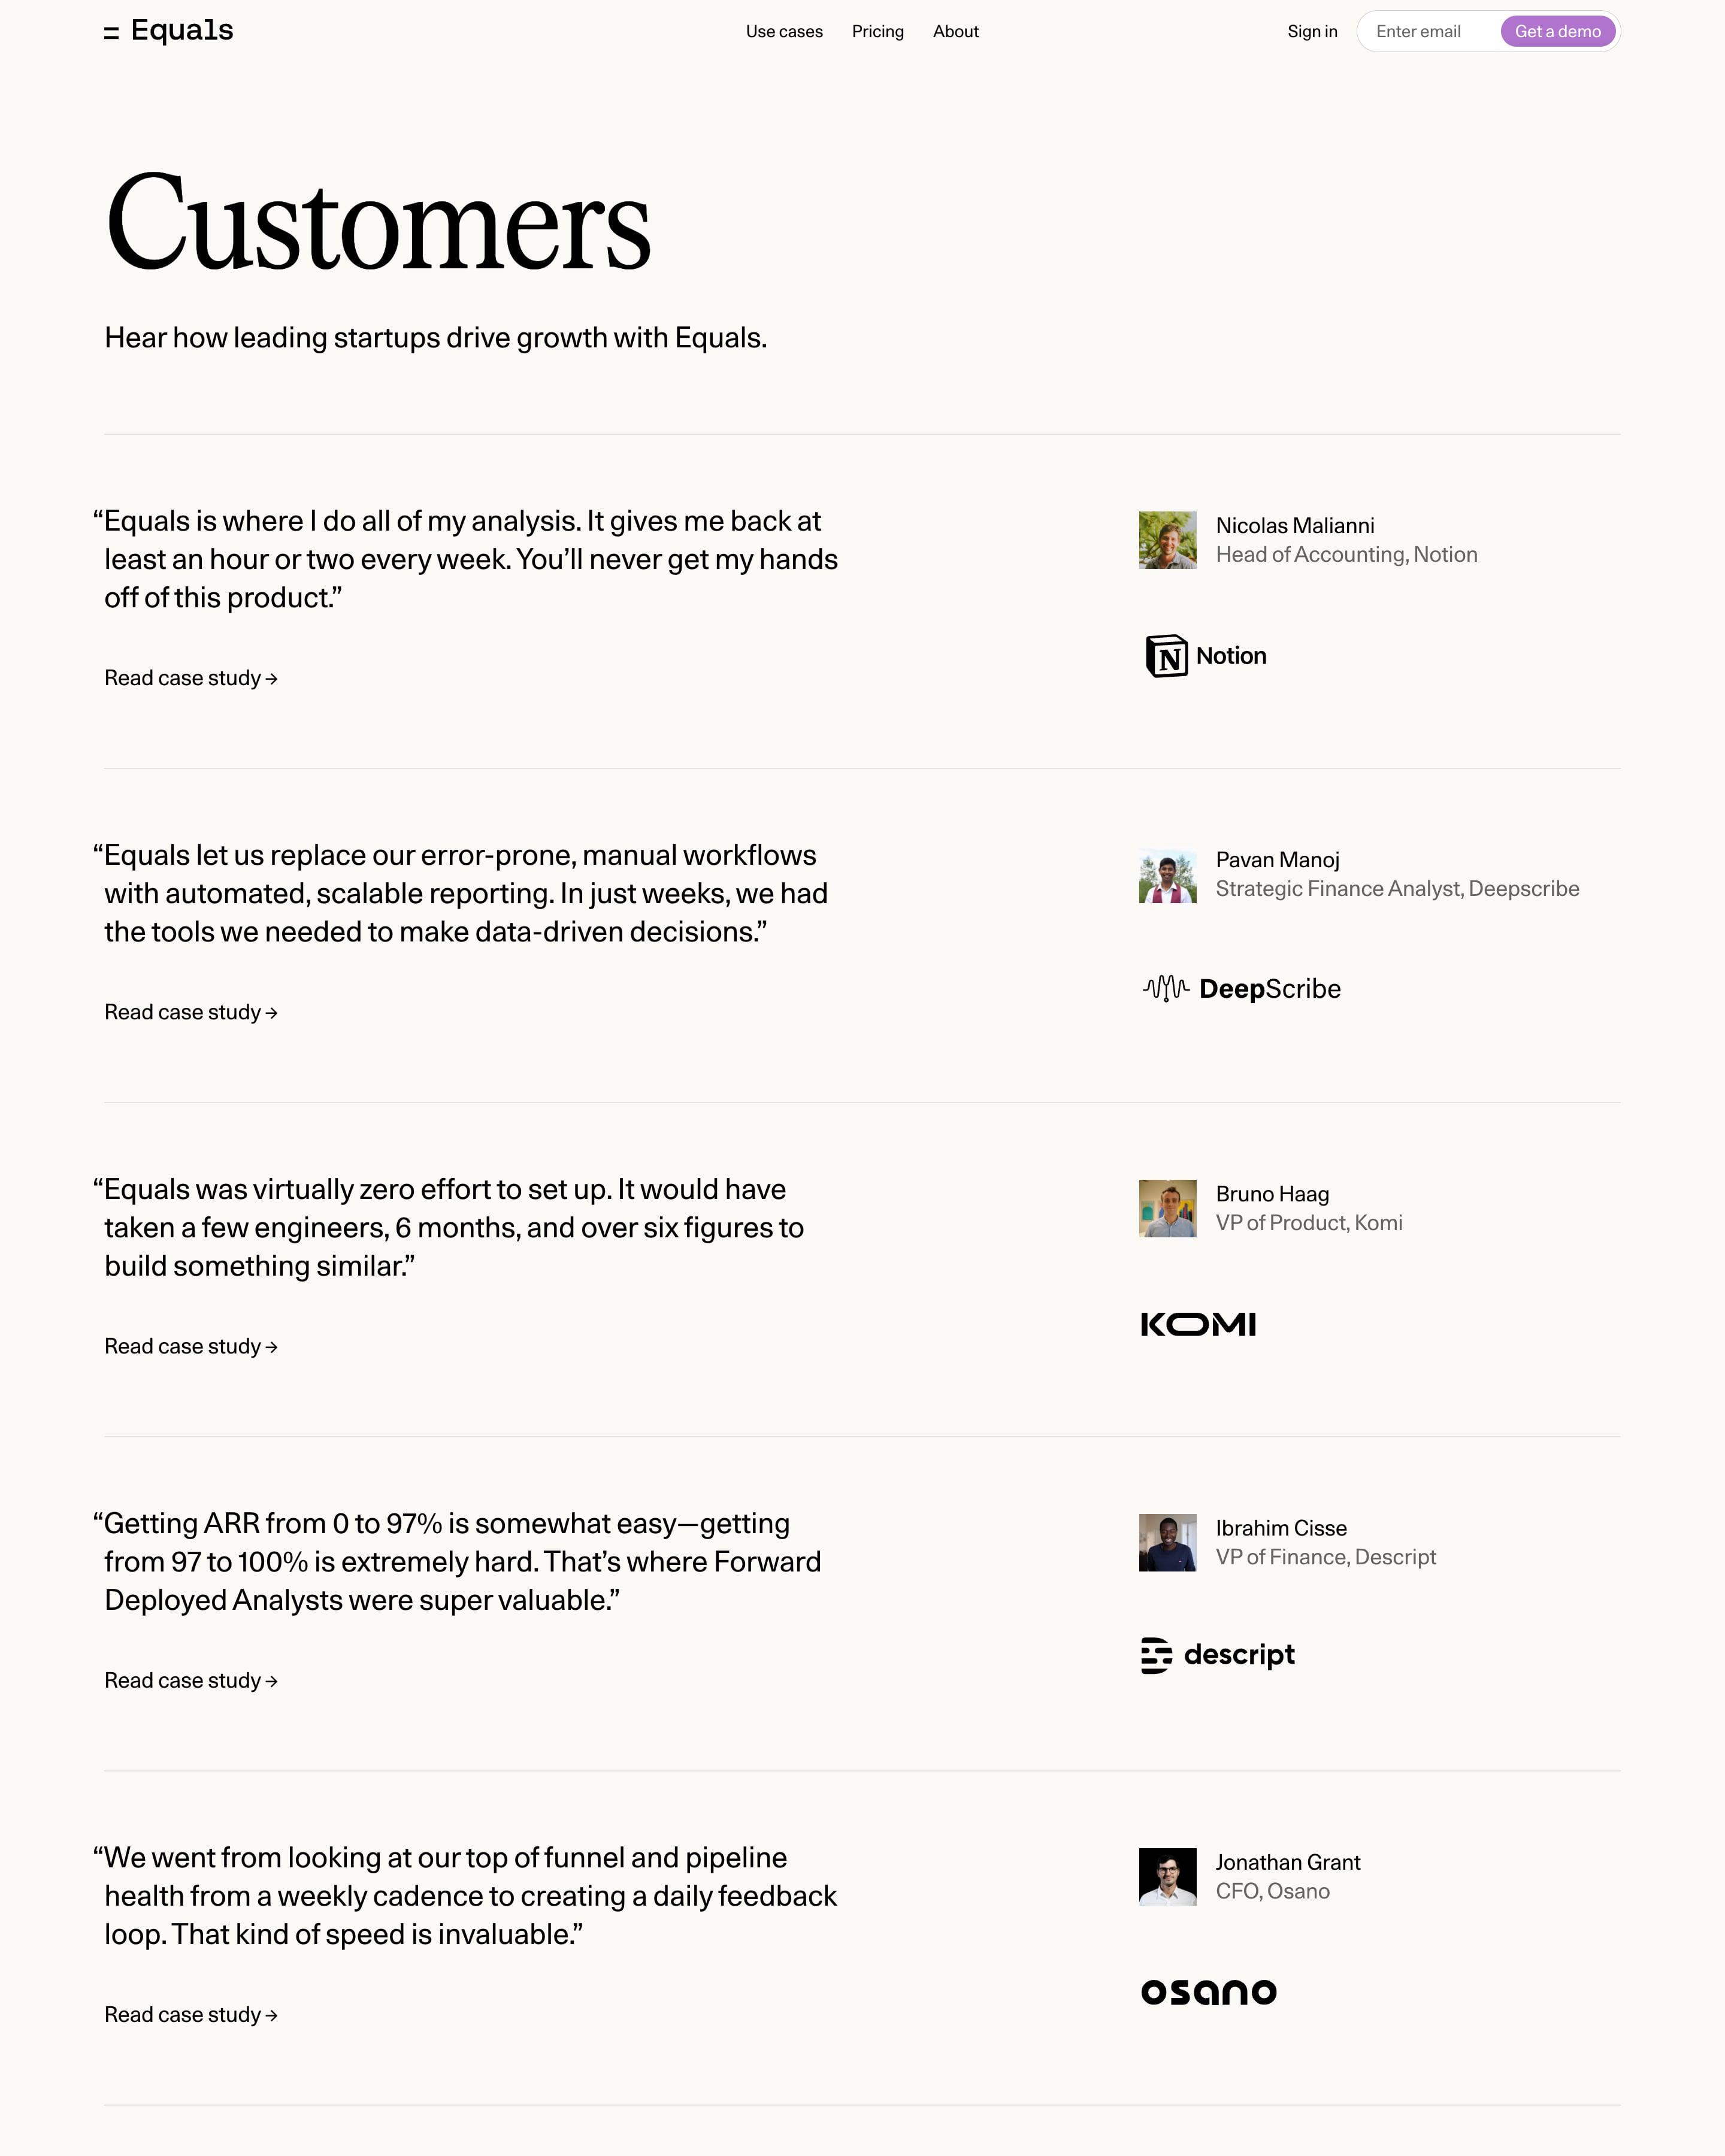
Customers appear as one column of quote rows split by hairlines, with the quote on the left and a headshot, name, title and logo on the right. A G2 strip, 4.8 out of 5 with badges, closes the list. That quote-left, credit-right row is simple to copy.
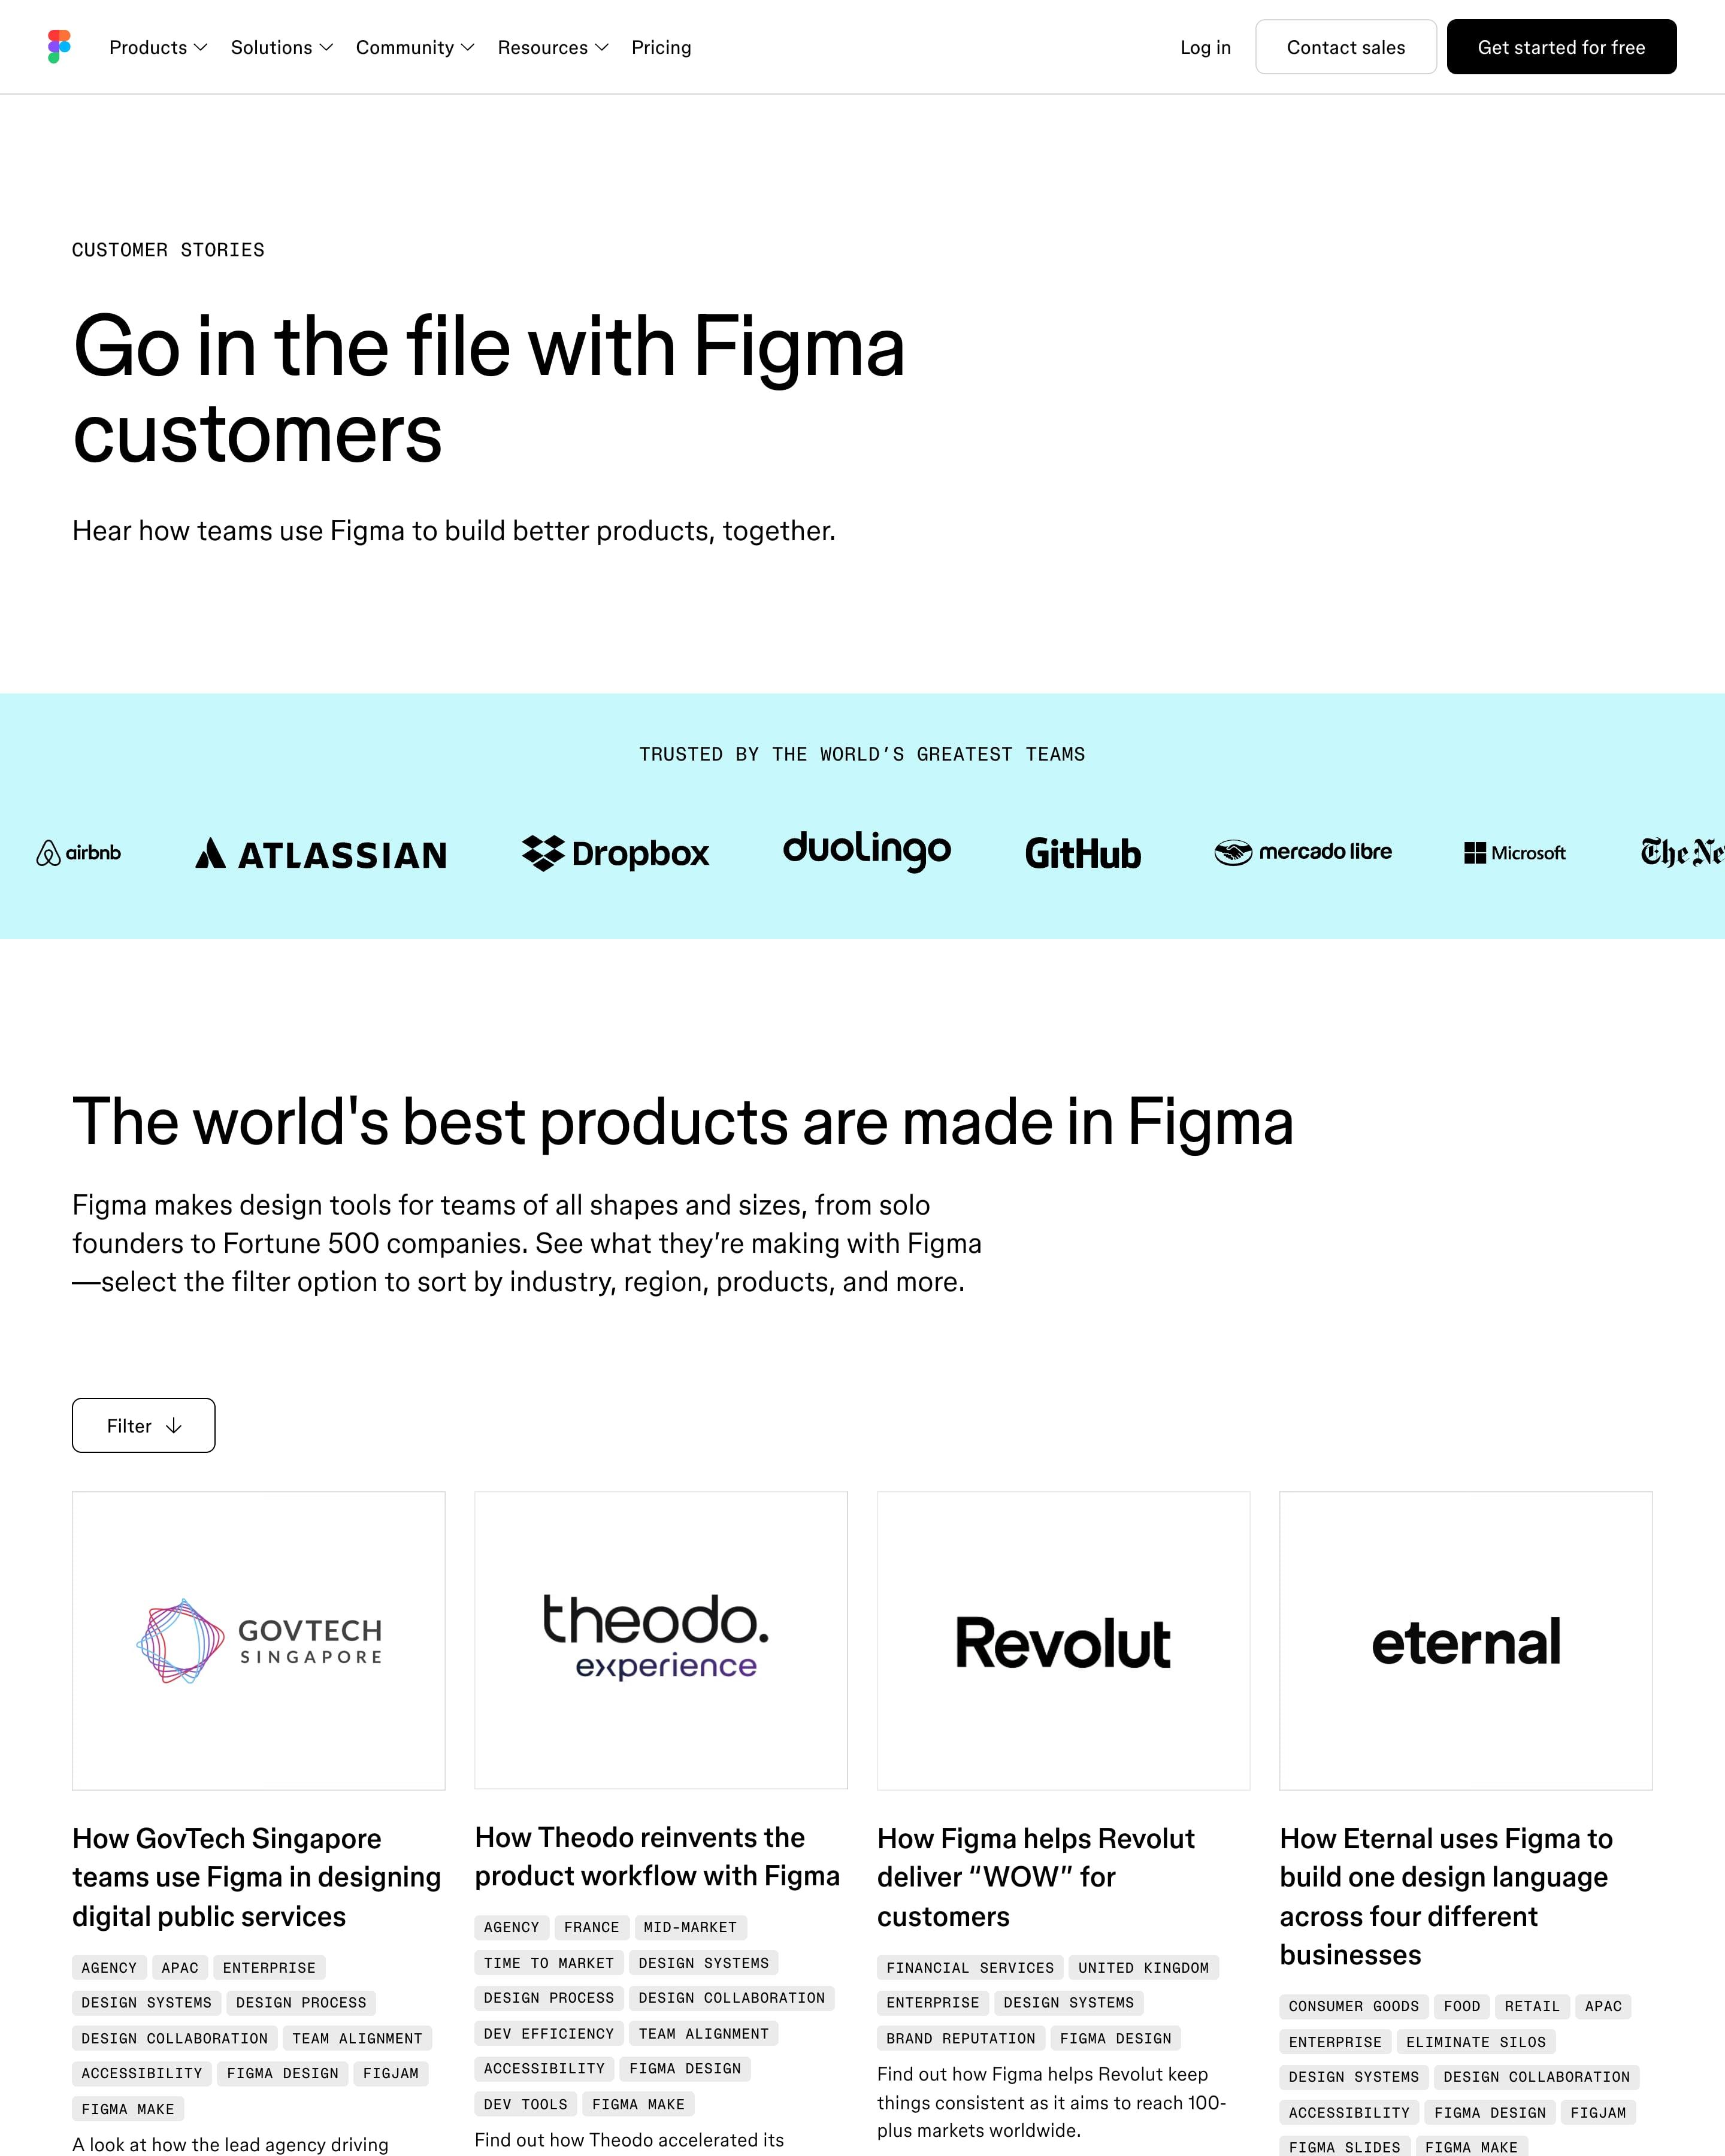
Story cards fill a four-column grid under a Filter button, each with a large logo tile and small tags for sector, region, topic and product. A black video carousel, a lilac blog feature and a pull quote follow. Worth copying: the tag chips, which make a long list quick to scan.
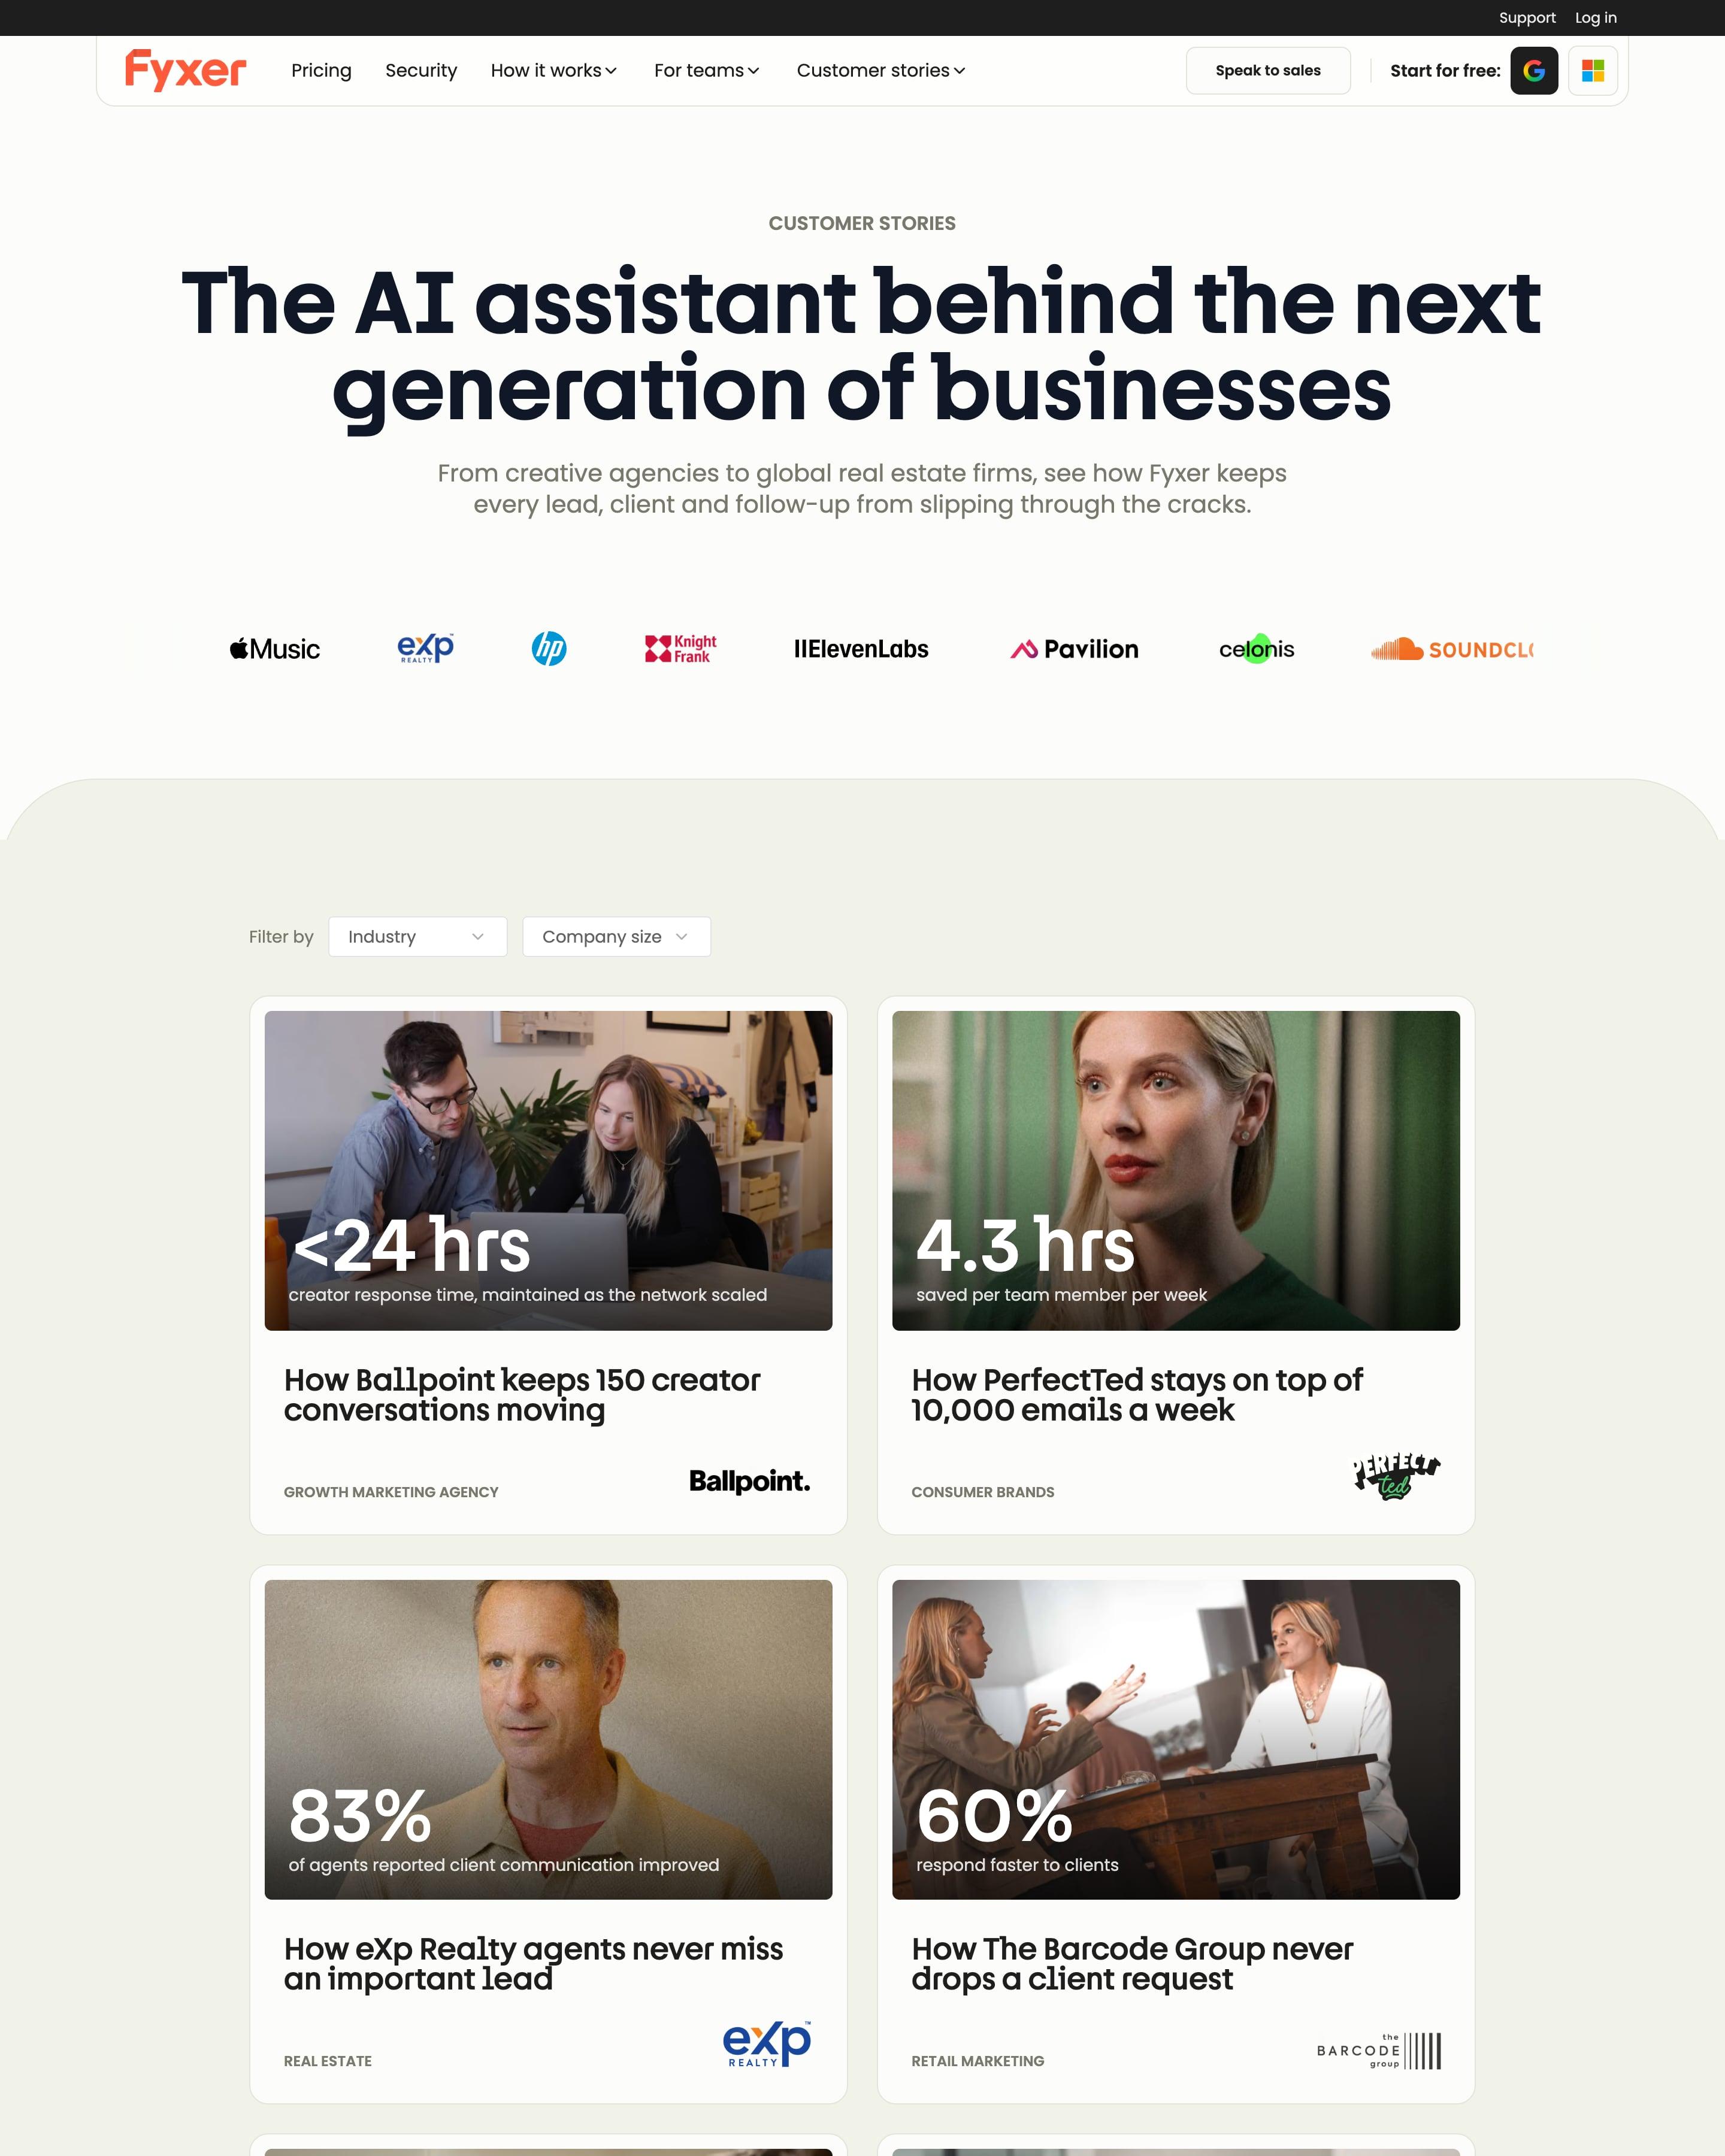
Seven story cards in a two-column grid, each a photo with one big white number on it: "<24 hrs", "4.3 hrs", "83%", "50%". Under the photo come a "How X..." headline, a small-caps industry label and the customer's logo on the right. Industry and company-size dropdowns sit above, and the closing CTA is a card with a folded orange corner, a motif the pricing and blog pages reuse.
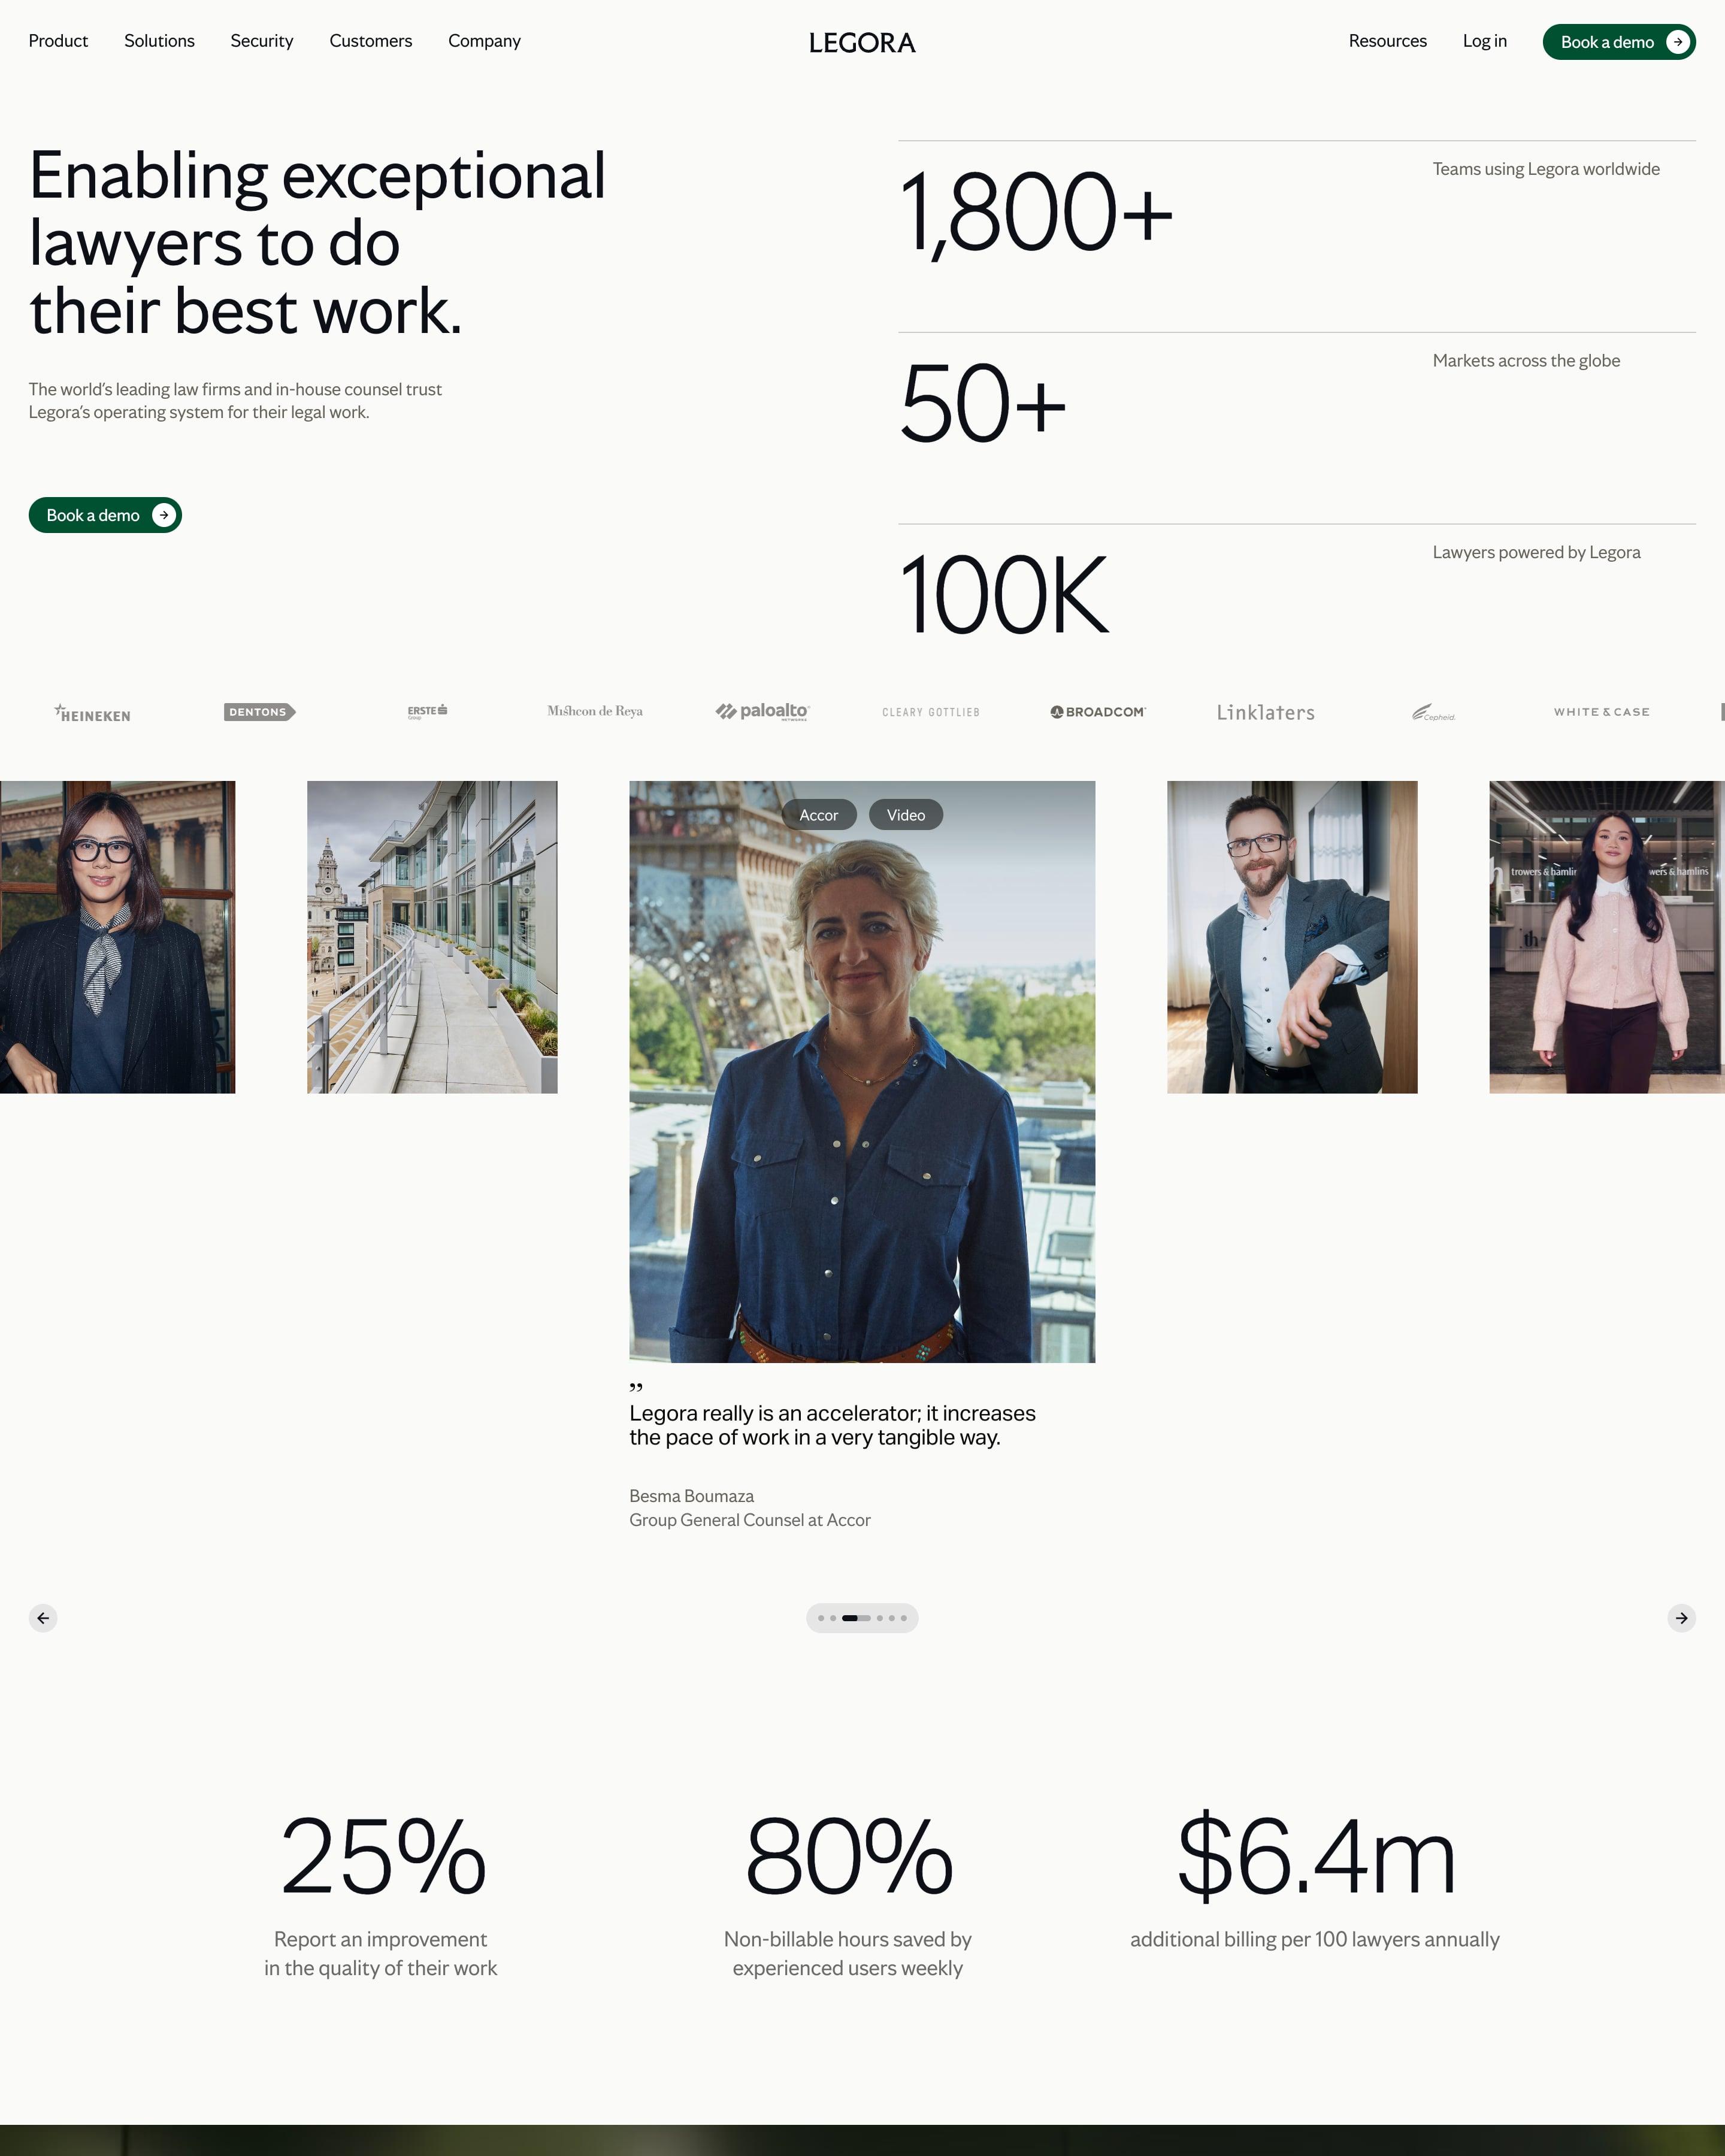
Beside the headline, three counts stack on hairline rules, and two more rows of stats break up the page. Stories sit in a filterable photo grid, some with the company name set huge over the image, followed by a bordered wall of customer logos. The stacked hero counts are a pattern to reuse.
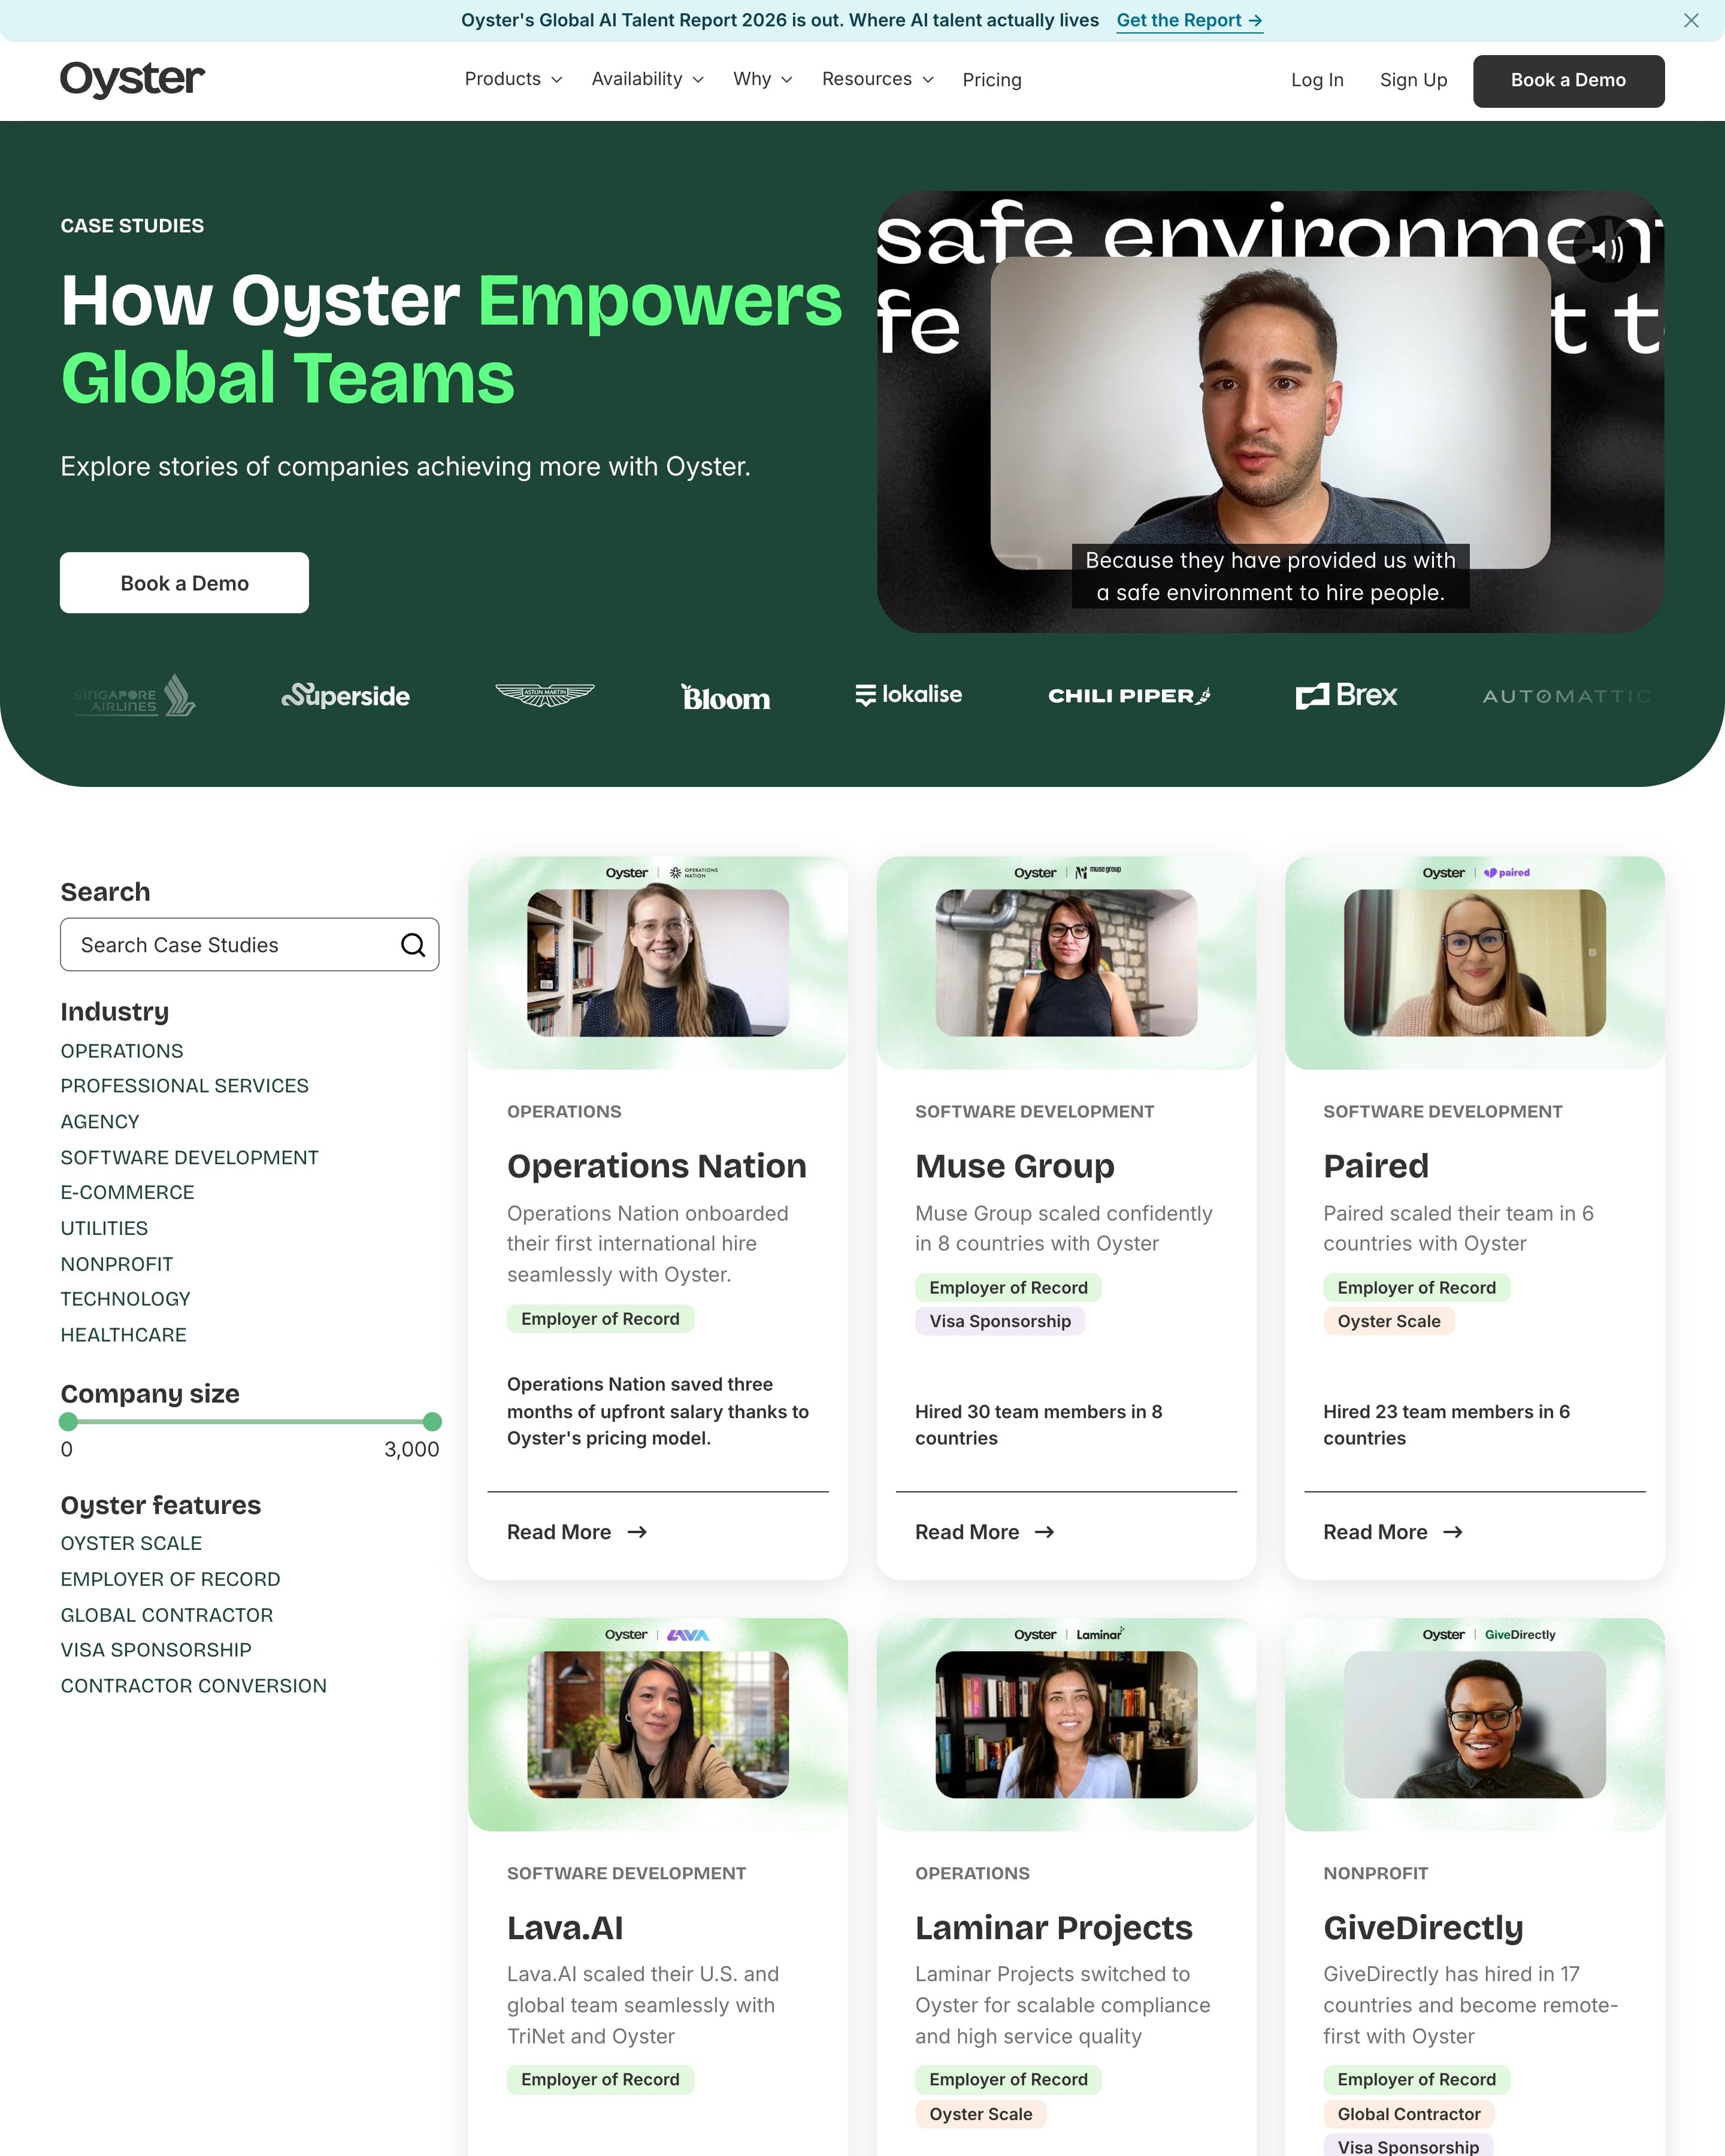
A sidebar of filters, including a company-size slider, sits beside a grid of case studies. Each card frames a customer like a video-call still and ends with a result, such as 30 hires in 8 countries. The impact band, four numbers each paired with a line drawing, is worth reusing.
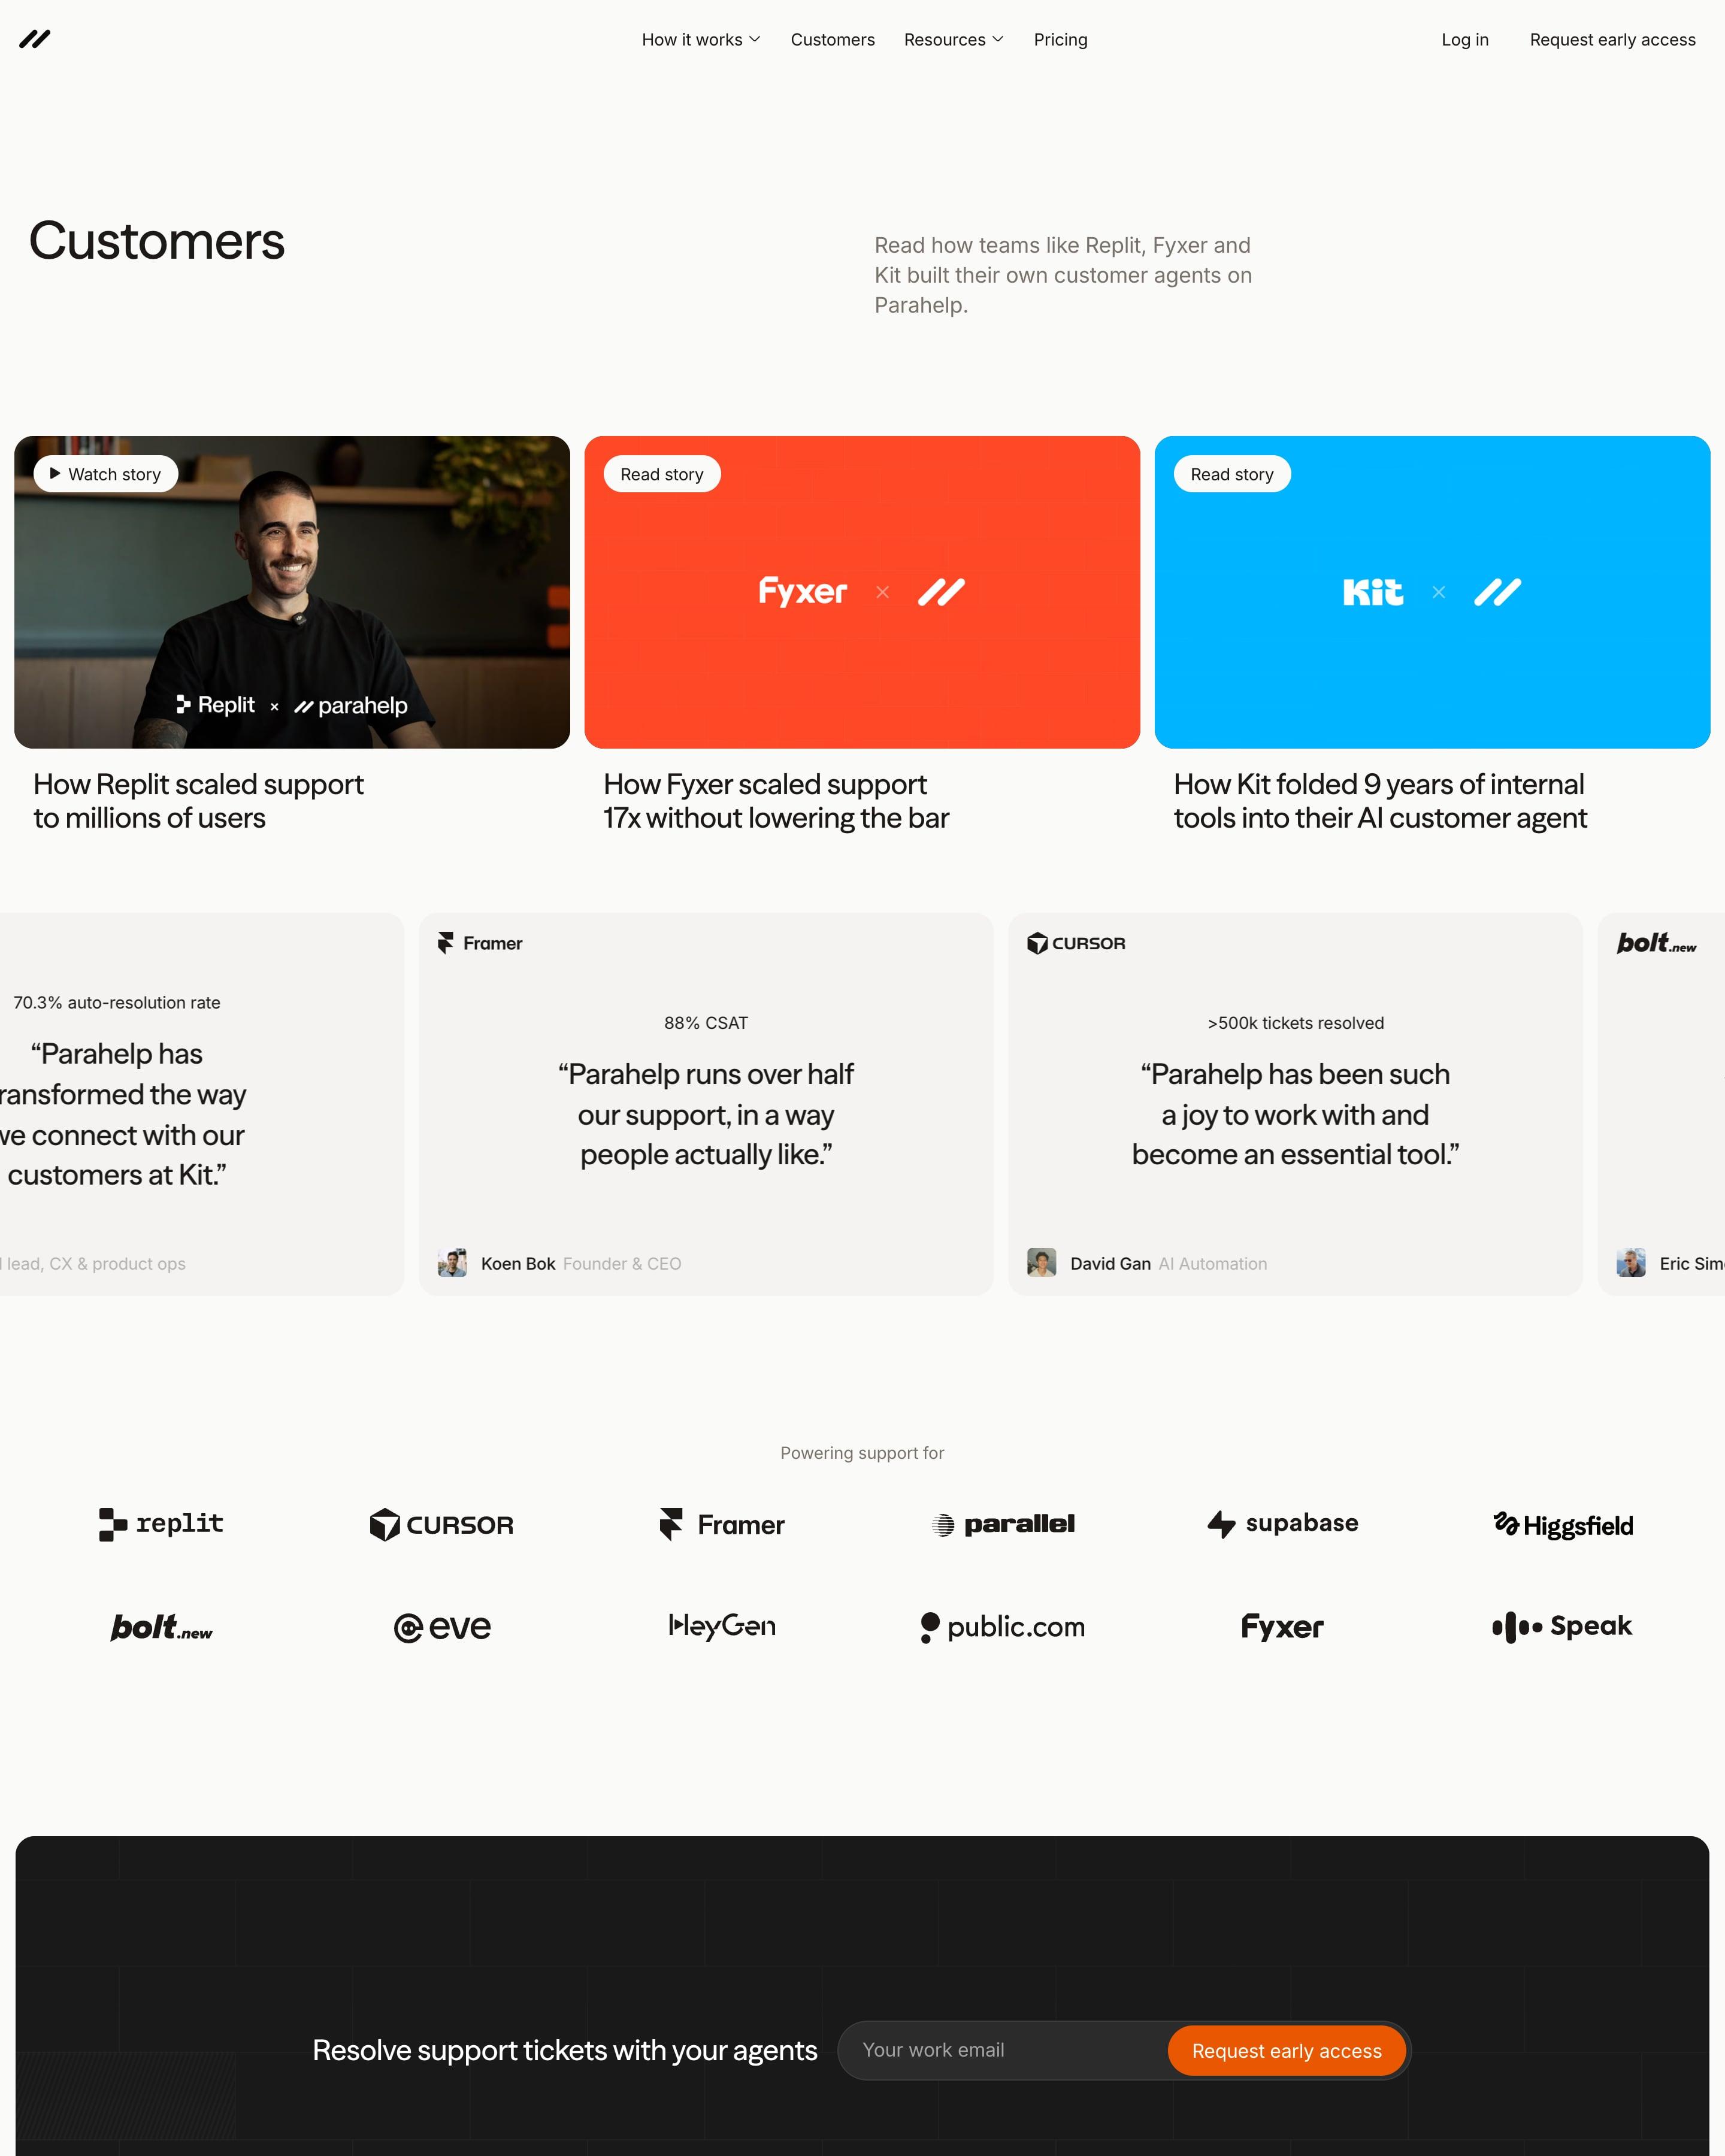
Three story cards lead: a video still for Replit, then co-branded tiles in flat orange and bright blue for Fyxer and Kit. A sliding row of quotes follows, each topped by a figure such as "88% CSAT". Heading each quote with its number is a trick worth taking.
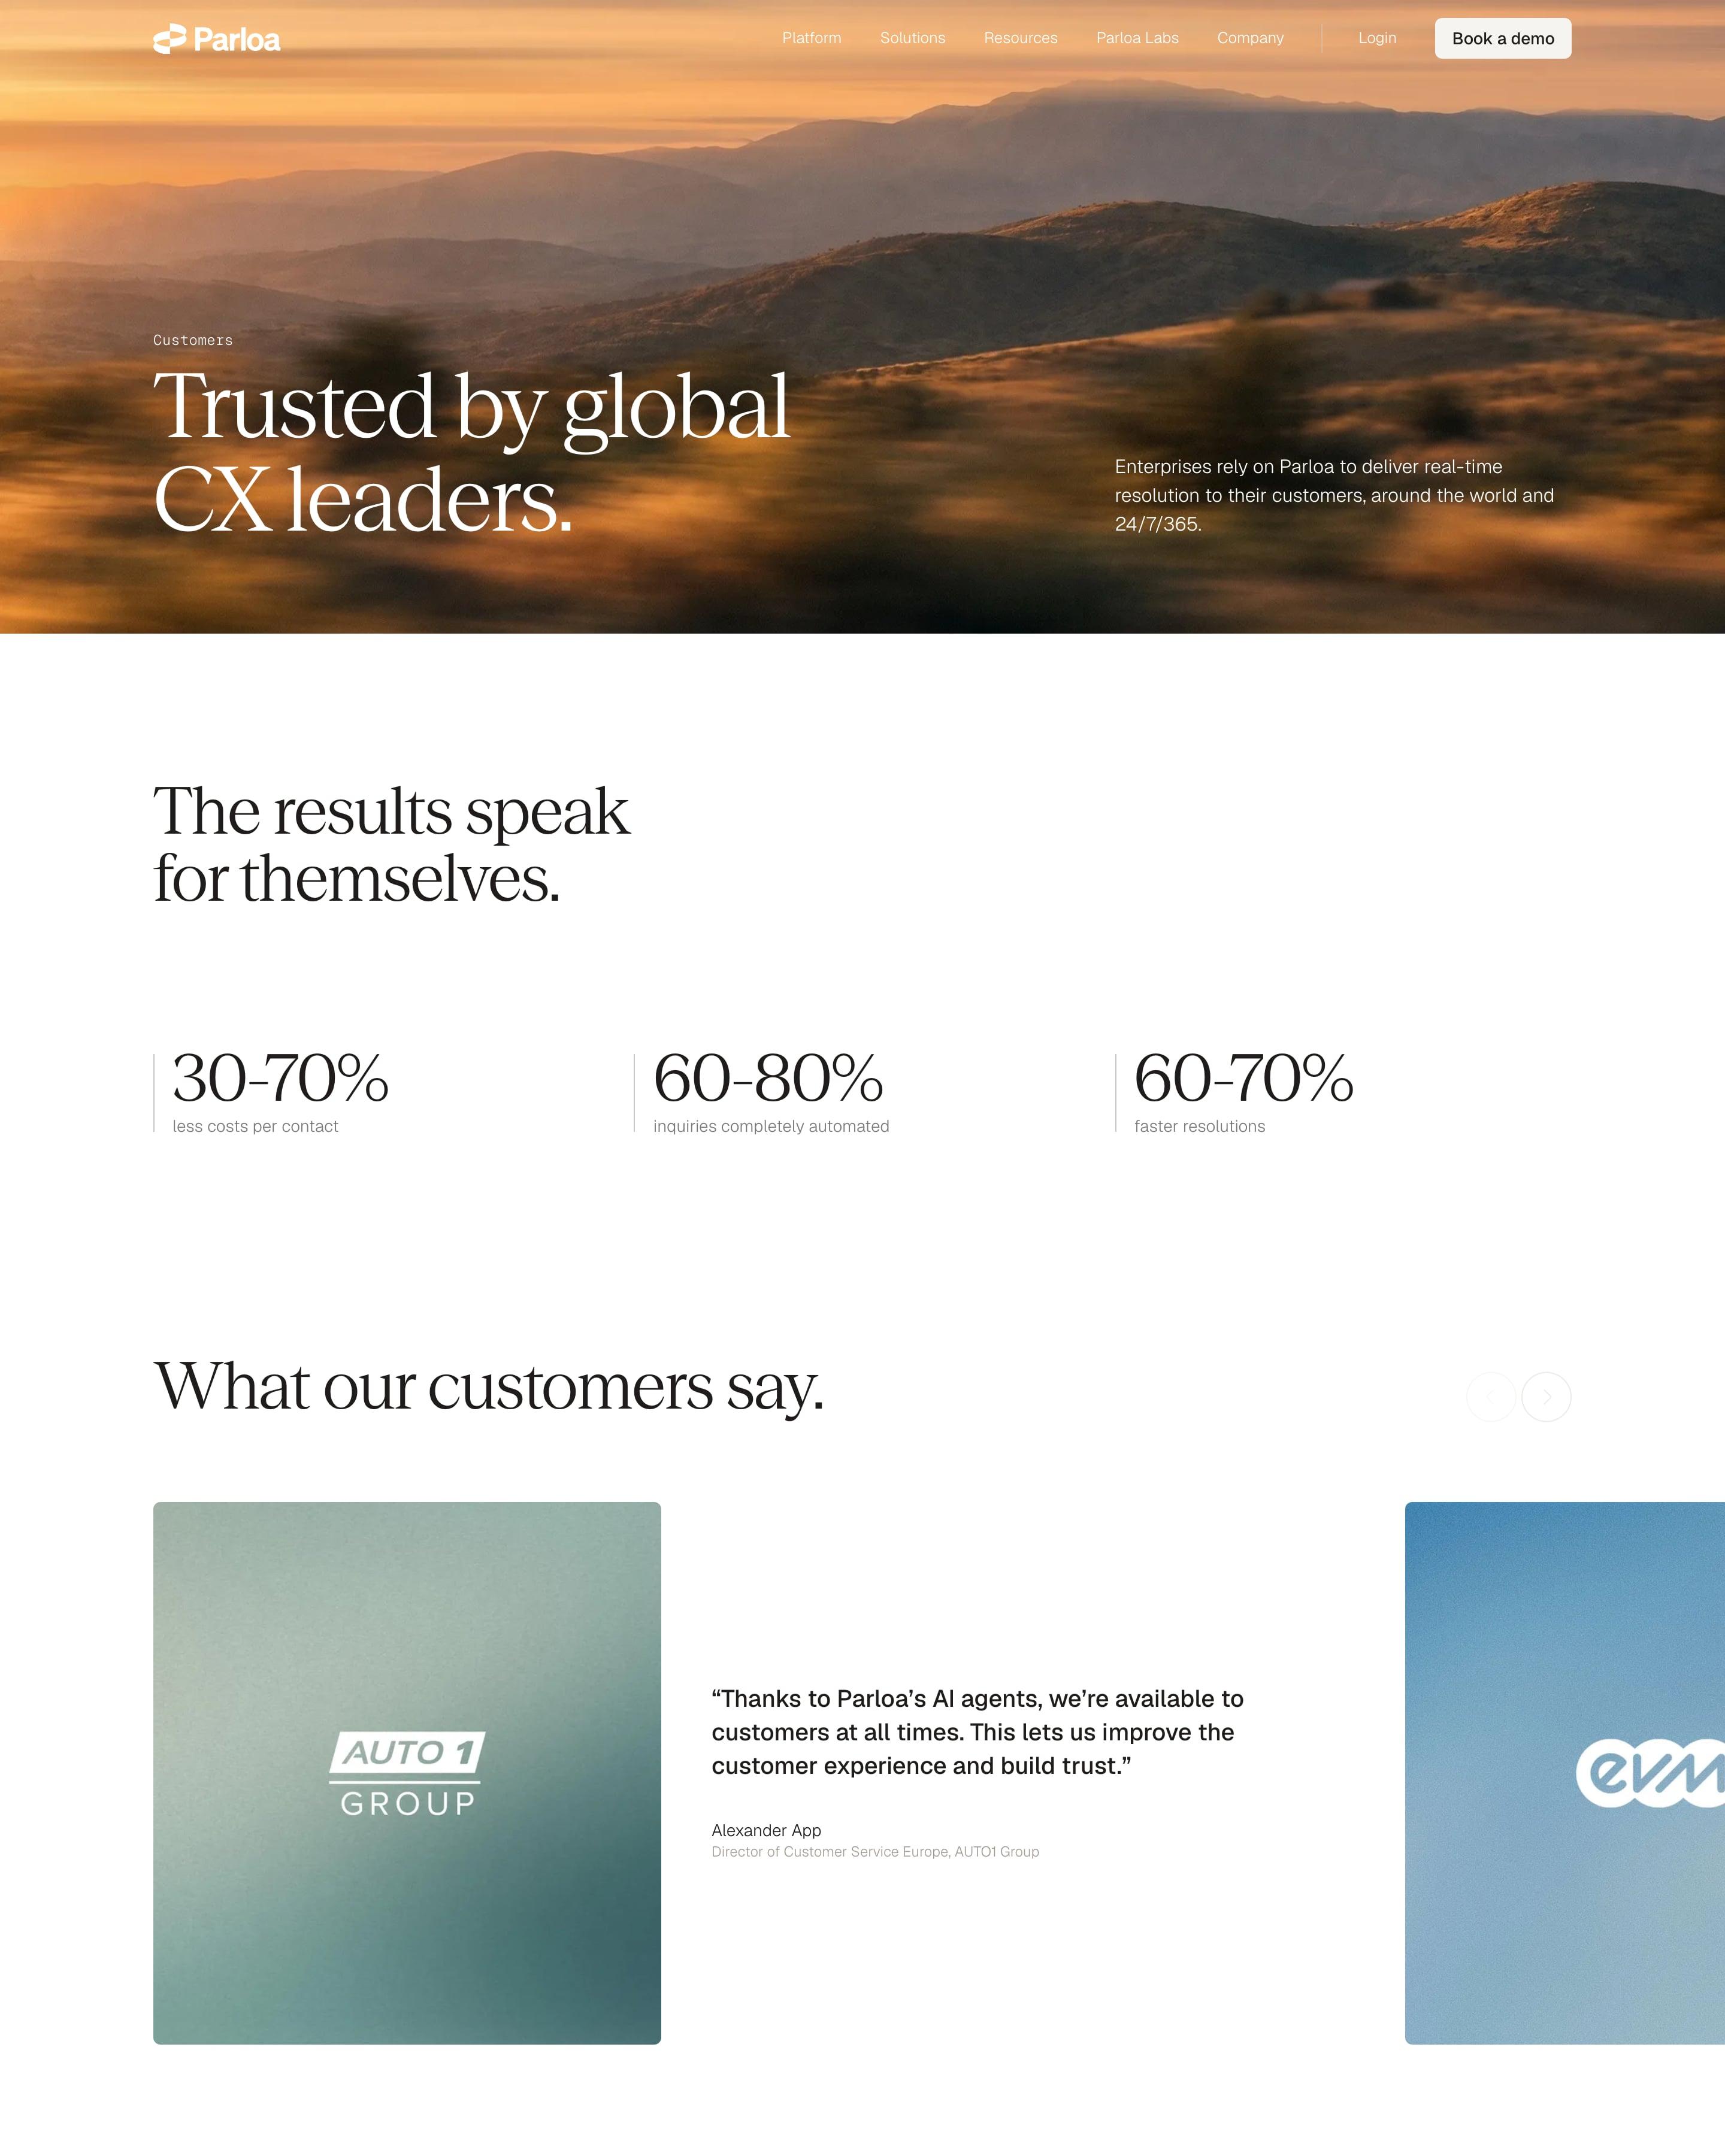
A sunset hills photo backs "Trusted by global CX leaders.", followed by three ranges like 30-70% and a featured BER Airport story. Then comes a three-column grid of about thirty stories, each a square soft-gradient tile with only the customer's white logo and a small industry tag. Anonymous customers keep the same tile with the Parloa mark and a label such as "TOP TELECOM BRAND".
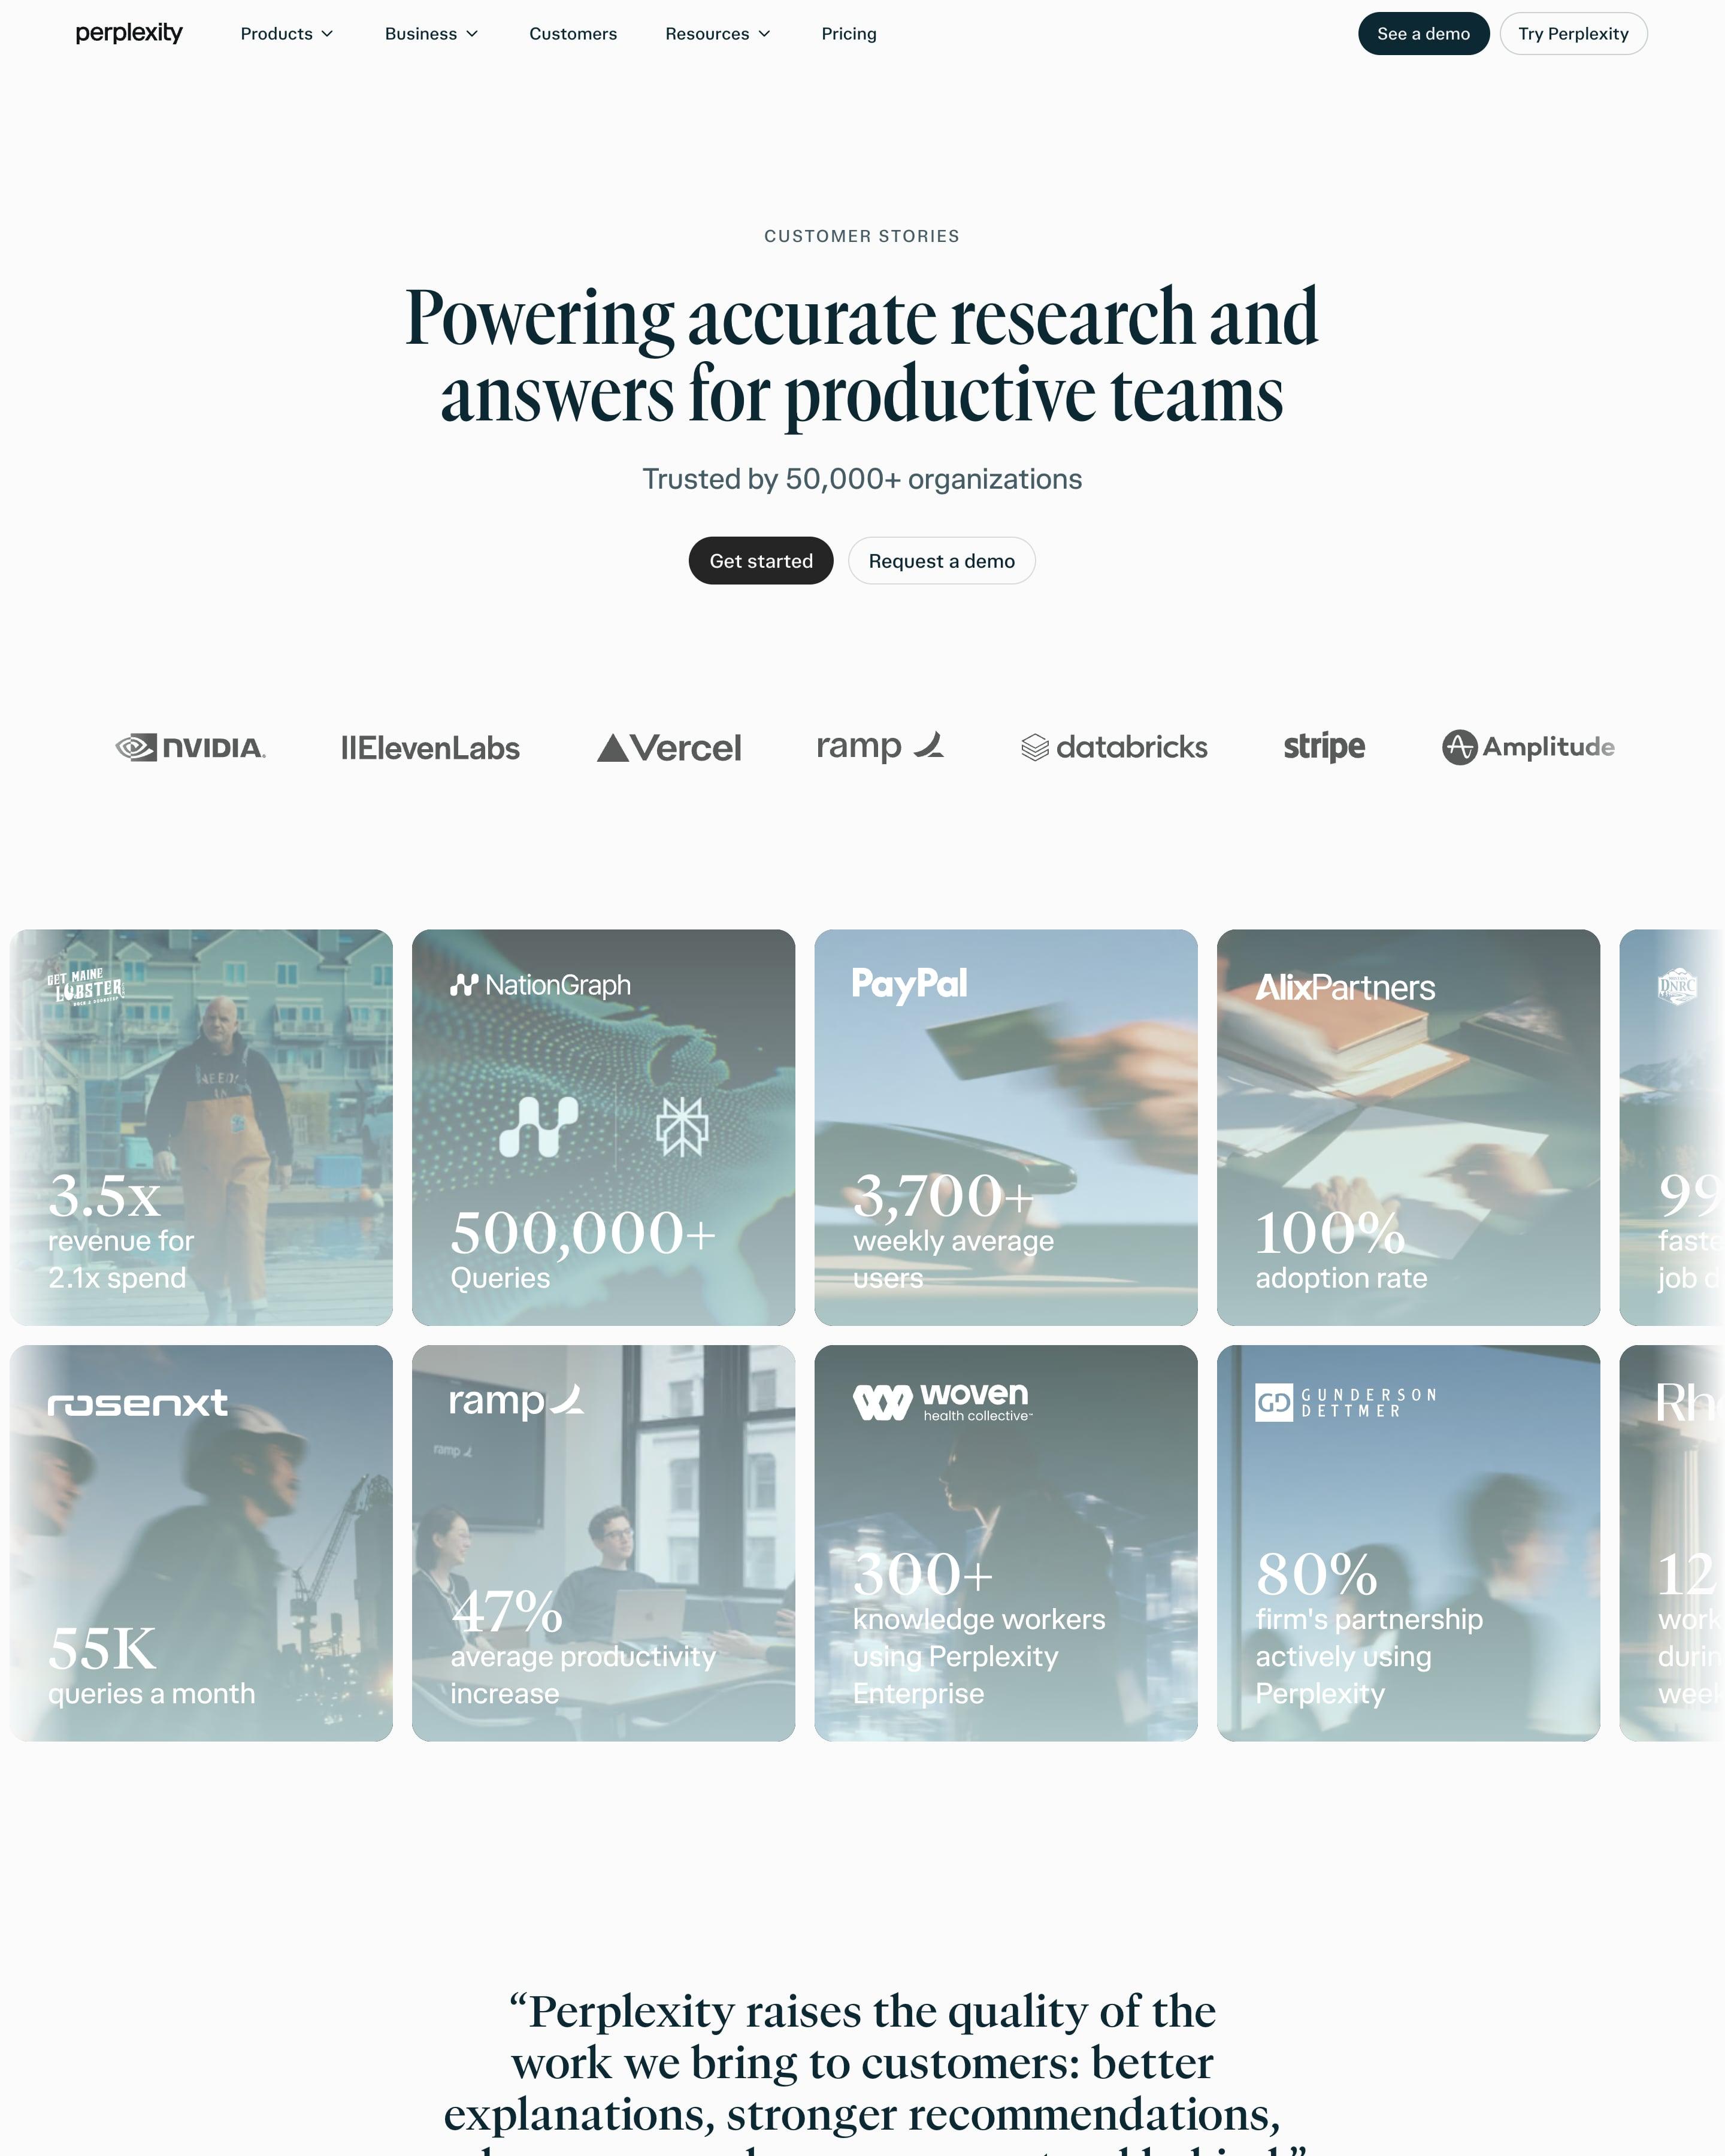
A small "CUSTOMER STORIES" label and condensed serif headline lead into a logo strip from NVIDIA to Amplitude. Two rows of photo tiles run off both edges, each washed in blue-grey with the customer's logo and one big serif number, like 3.5x revenue for Get Maine Lobster or 500,000+ queries for NationGraph. Below, a filterable grid of plain white cards pairs each logo with a "How…" headline.
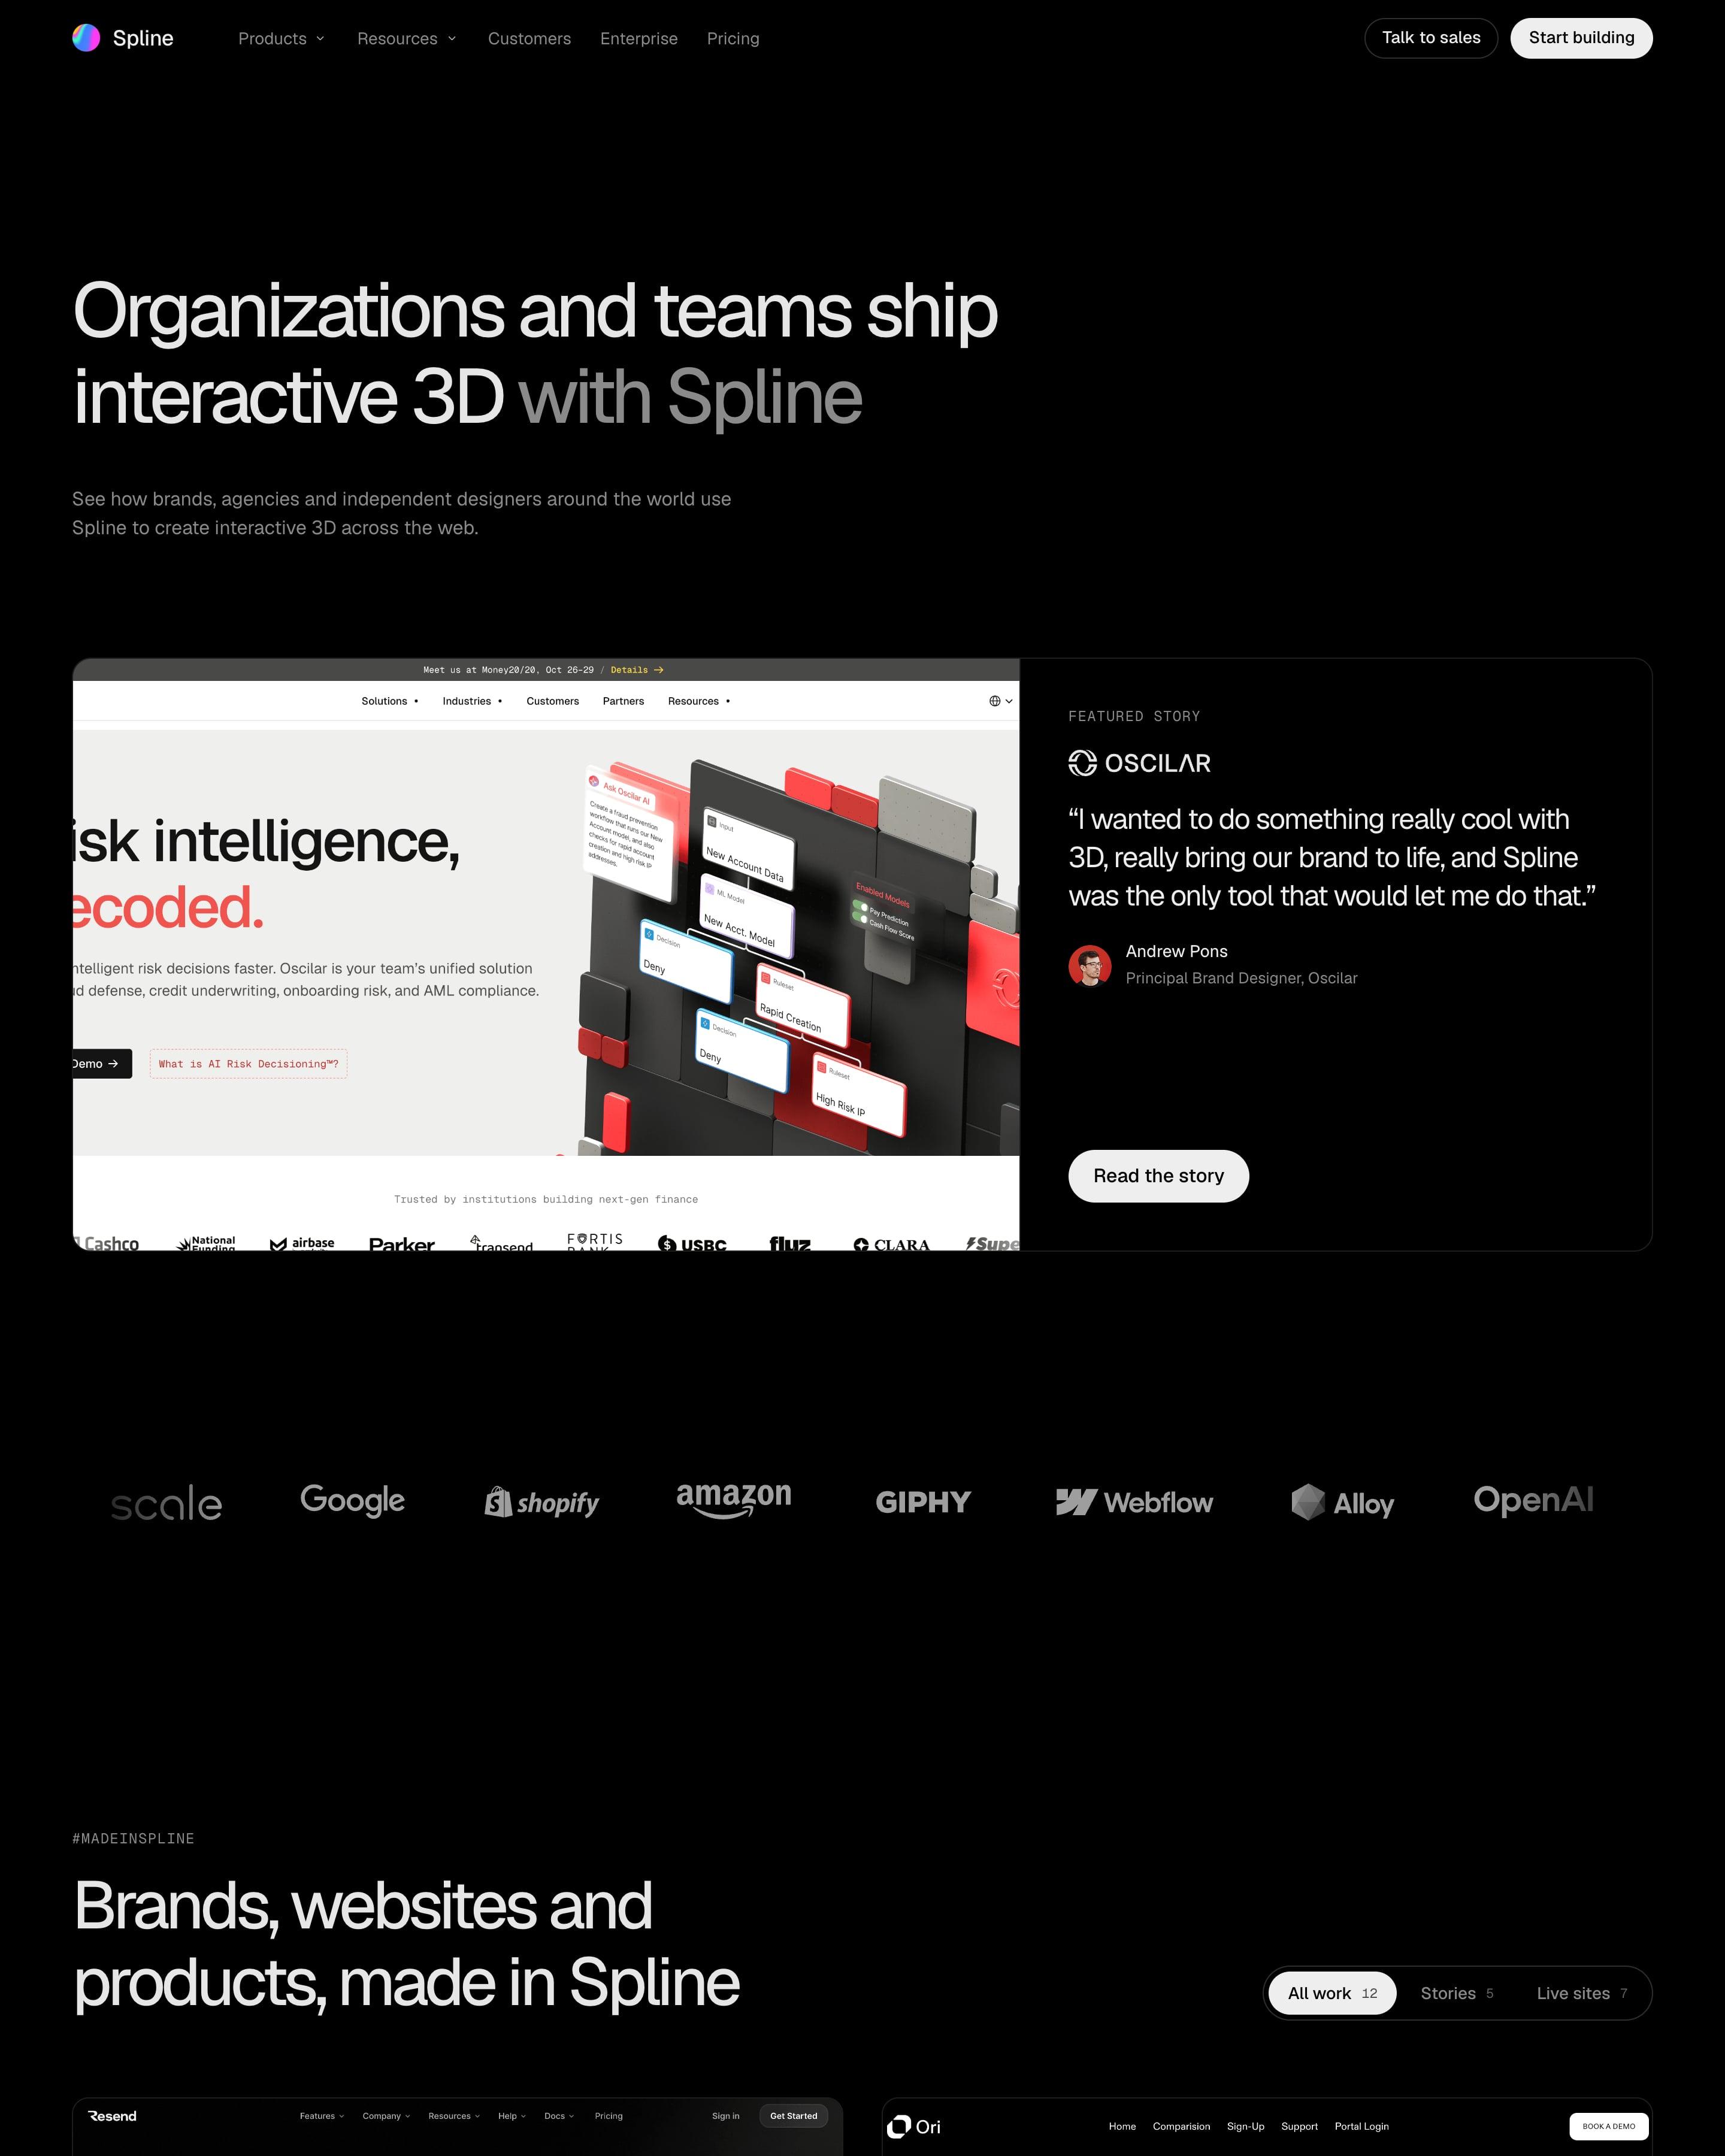
Much of this page is a two-column gallery of 3D work for Resend, Forbes, Polaroid and others, each tile marked 'Read story' or 'Visit site', with pills to filter stories from live sites. Up top, a split card pairs a customer's site with a quote. The lesson: show the work itself.
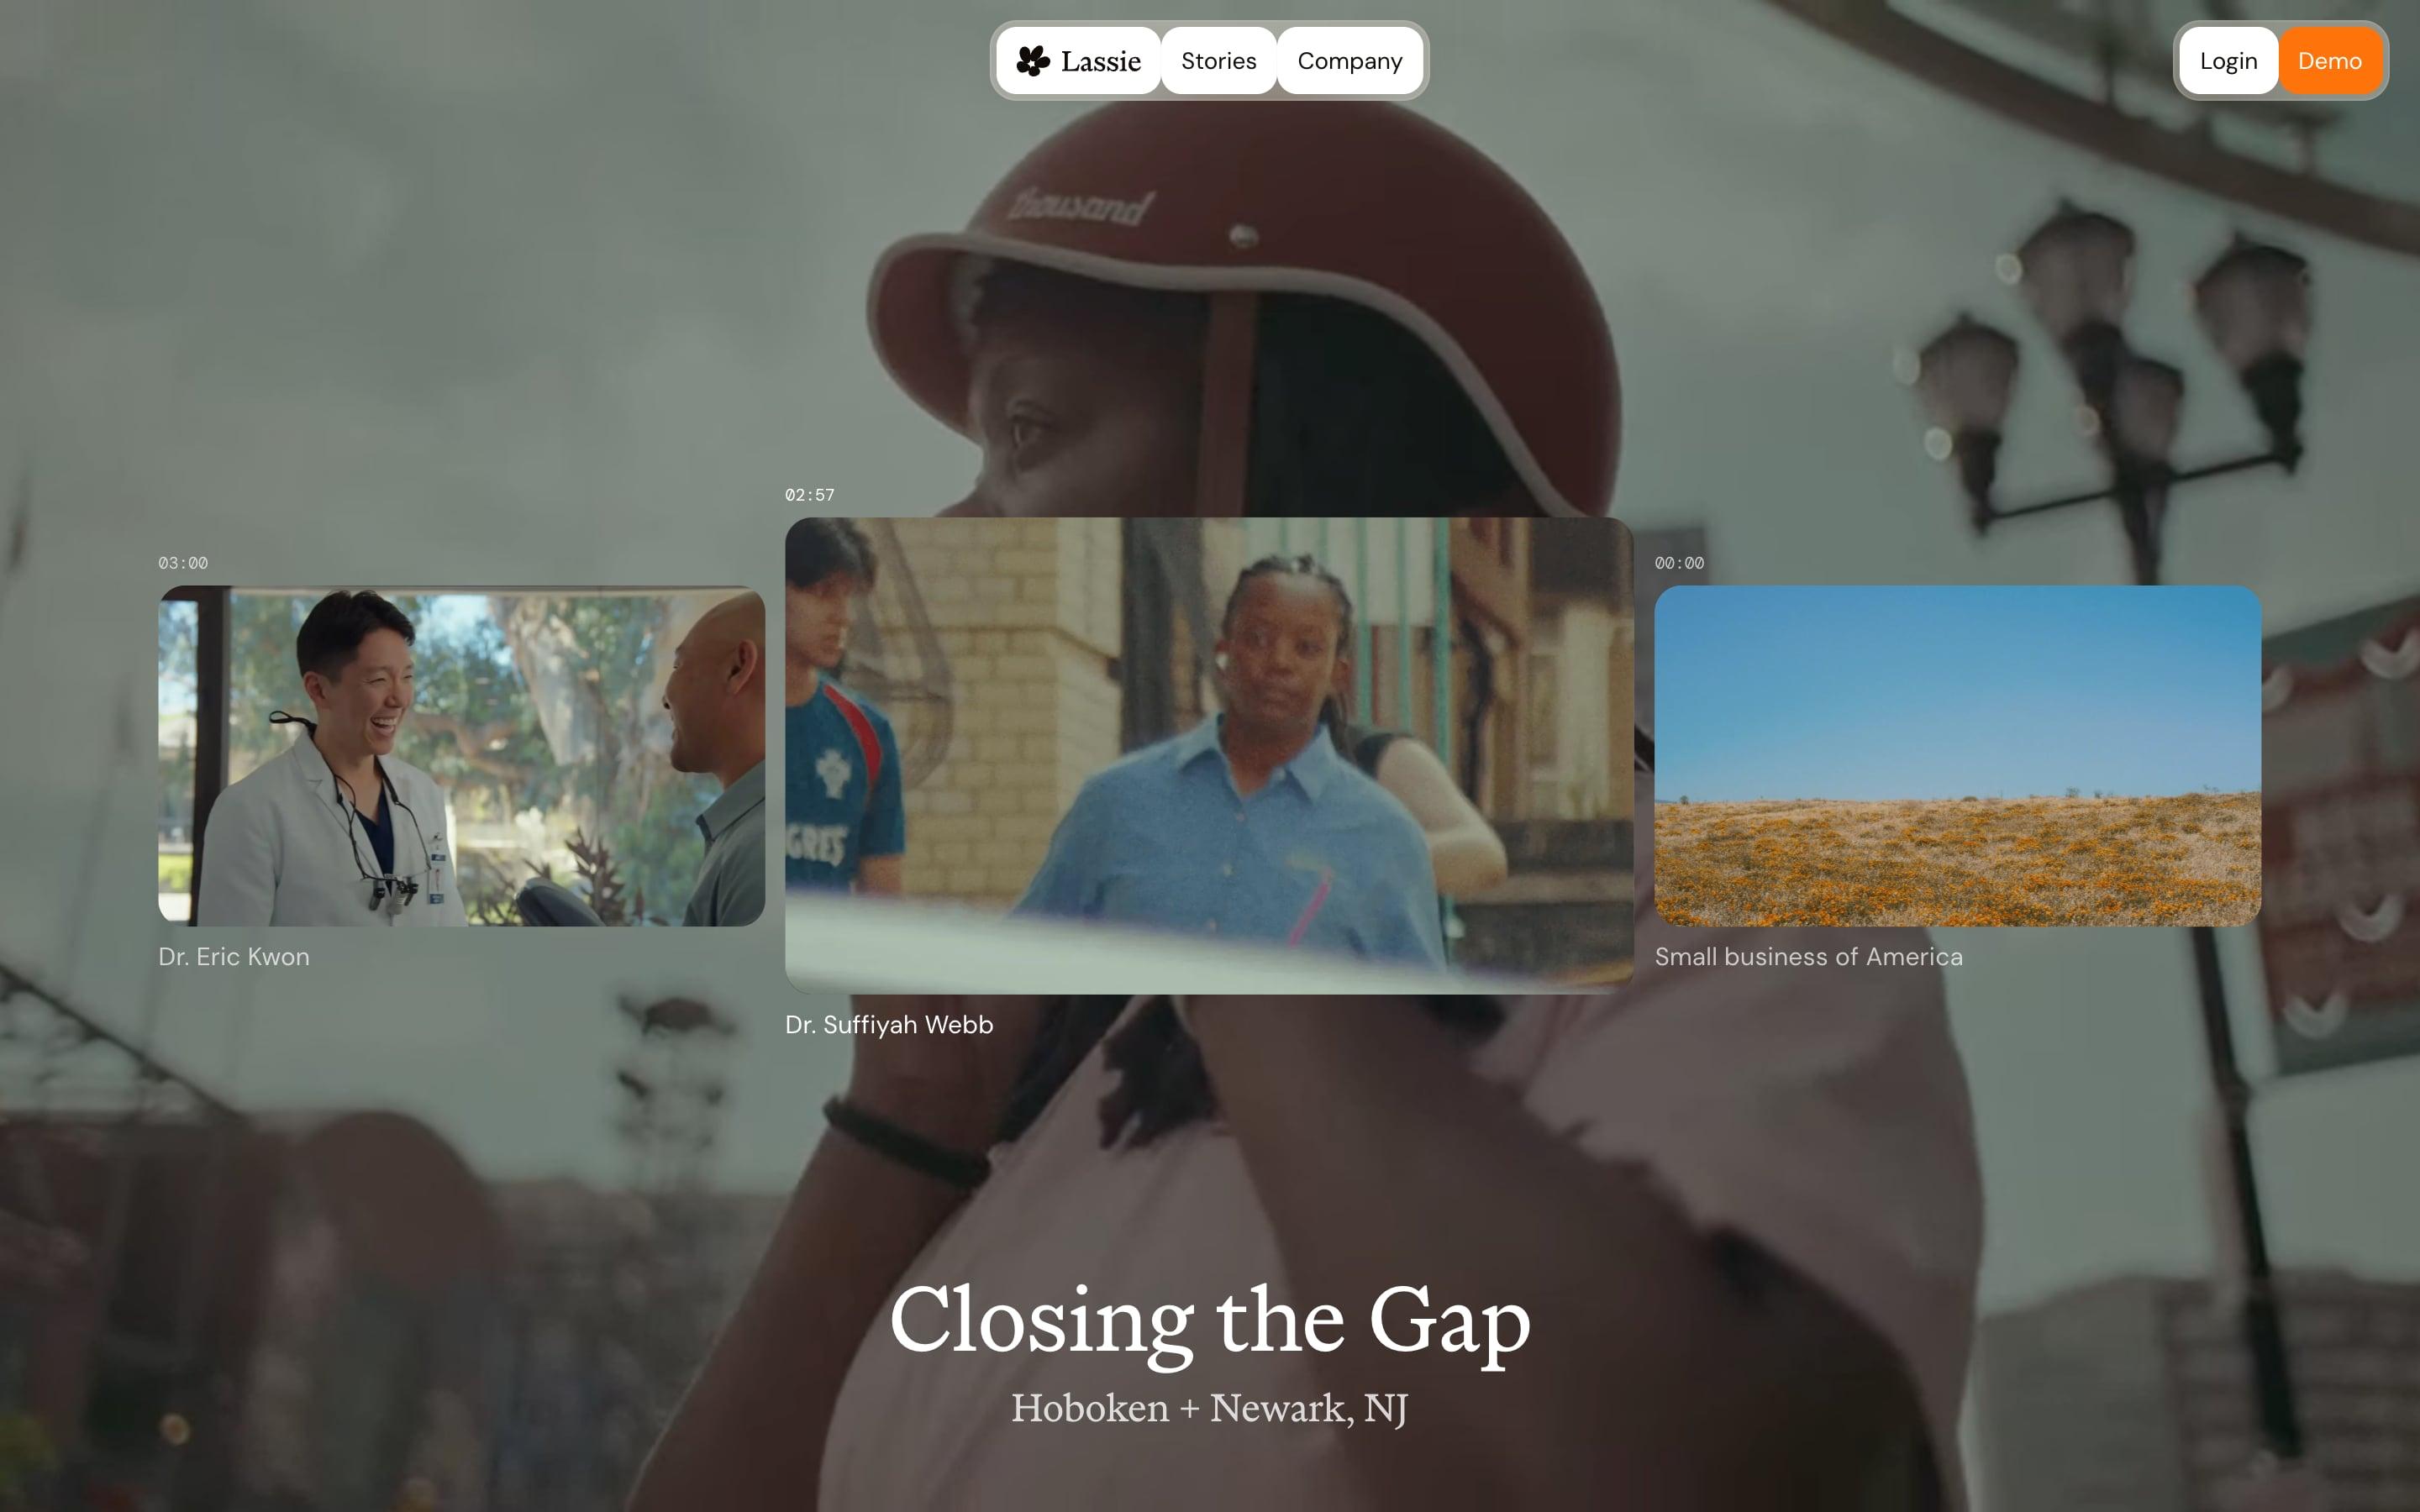
Stories are a single-screen video wall: a blurred still of the current film fills the background, with three clips in a row and the middle one enlarged. Small timecodes above each clip are worth borrowing, and the doctor's name sits below. The title, "Closing the Gap", and its town appear in large serif type.
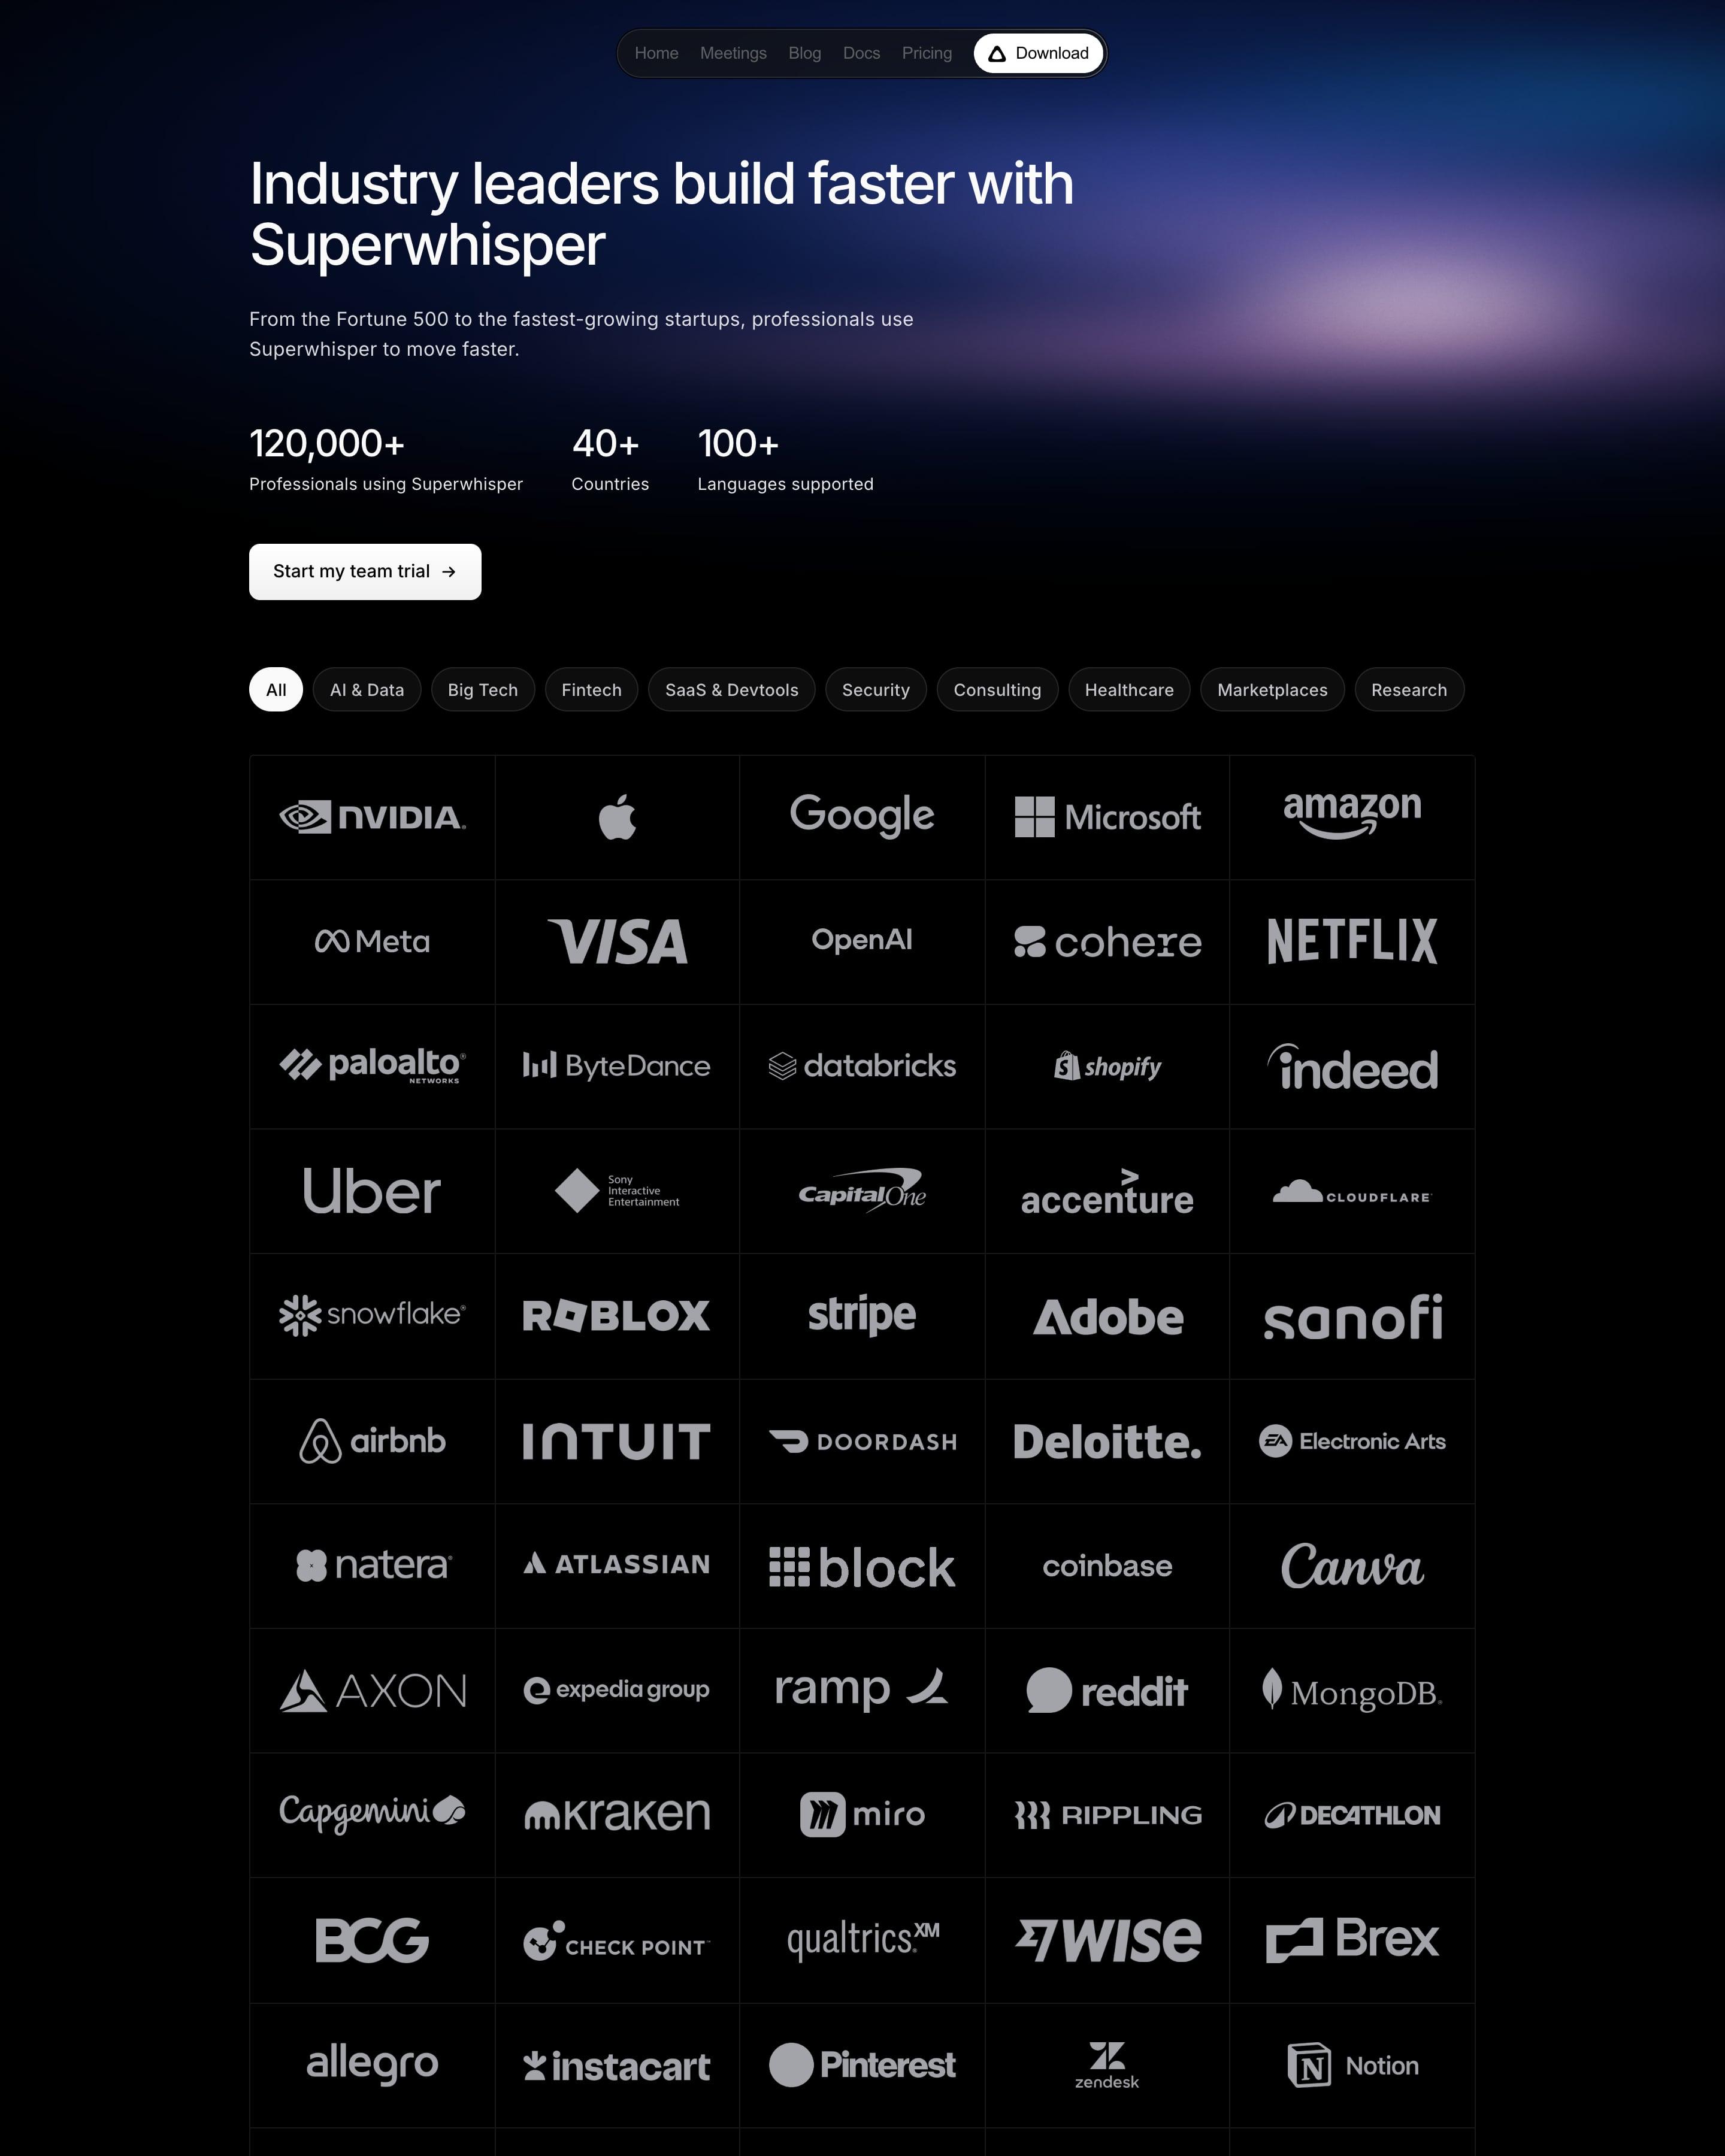
There are no case studies, just a wall of white logos from Nvidia to Georgia Tech in a bordered five-column grid. The industry pills that filter it, from AI & Data to Research, are worth borrowing. Three numbers and a team-trial button sit above the wall under a soft purple glow.





















































By page type
Frequently asked questions
Stories that lead with results: named customers, their logos, the problem they had and a number that changed. Filters by industry or company size help a buyer find a story like their own.
Each page is opened at 1440 pixels wide, like a laptop, and scrolled from top to bottom so every image and section loads. Cookie banners, chat bubbles and popups are left out, and the whole page is saved as one image.